Math Pathways | High School Math Profile
Math skills are vital for student success in postsecondary education and the workforce. Research shows that when education systems support student completion of math all four years of high school, and provide the access and support to complete advanced math courses like Advanced Placement (AP)/International Baccalaureate (IB)/Dual Credit math in high school, students successfully obtain a postsecondary credential and earn a living wage job at a higher rate. Exposure to high-quality math instruction in the classroom across the pipeline helps students thrive and excel in the higher skills needed for college and career.
Jump to: Source and cohort information about this data.
The Importance of Math Pathways
Math is a skill that builds upon previous concepts, and math skills often atrophy quicker than other skills outside of the classroom. E3 Alliance research finds that completing four years of math in high school, with the fourth year of math aligned to college-level coursework, sets students up for postsecondary success. Education systems can support students in meeting this goal by:
- Encouraging students to take math all four years of high school,
- Ensuring access to high quality math instruction,
- Providing access to diverse math pathways that align with students’ college and career goals,
- Adopting practices to accelerate students based on math aptitude rather than teacher, parent, and student perception of ability,
- Ensuring all students take at least one college-credit-bearing course in high school
2023-24
35%
7,693 / 21,825
Central Texas
College-Credit-Bearing Math Completion Rate
2023-24
28%
86,110 / 306,608
Texas
College-Credit-Bearing Math Completion Rate
The level of math students take matters
The level of math students take matters
Math Pipeline by Emergent Bilingual (EB) Status
Math Coursetaking Patterns Have Shifted Over Time
Over the past ten years, math coursetaking patterns have changed significantly, and it is important to understand these changes so that we support students with appropriate advanced math pathways aligned with their career aspirations.
When districts provide diverse math offerings, like statistics and quantitative reasoning, in addition to the traditional pathways of algebra to pre-calculus and calculus, they provide students with pathways that may more closely align with their college and career goals. When these courses also allow students to earn college credit, they ensure that their students have a head start towards a postsecondary credential or degree.
The good news is, despite changes to policy that no longer require students to take four years of math, approximately three out of four seniors are taking and completing four years of high school math. Taking this fourth year ensures students’ math skills stay fresh in their mind, and allows them the opportunity to take a math course that is aligned with their college or career goals.
College-Credit-Bearing Math Completion Increasing in Last Decade
Texas has seen an overall upward trend in college-credit-bearing math completion rates for the past ten years.
See how the trend in your region compares to the state at large by using the comparison feature.
Persistent Disparities Exist in College-Credit-Bearing Math Completion by Household Income
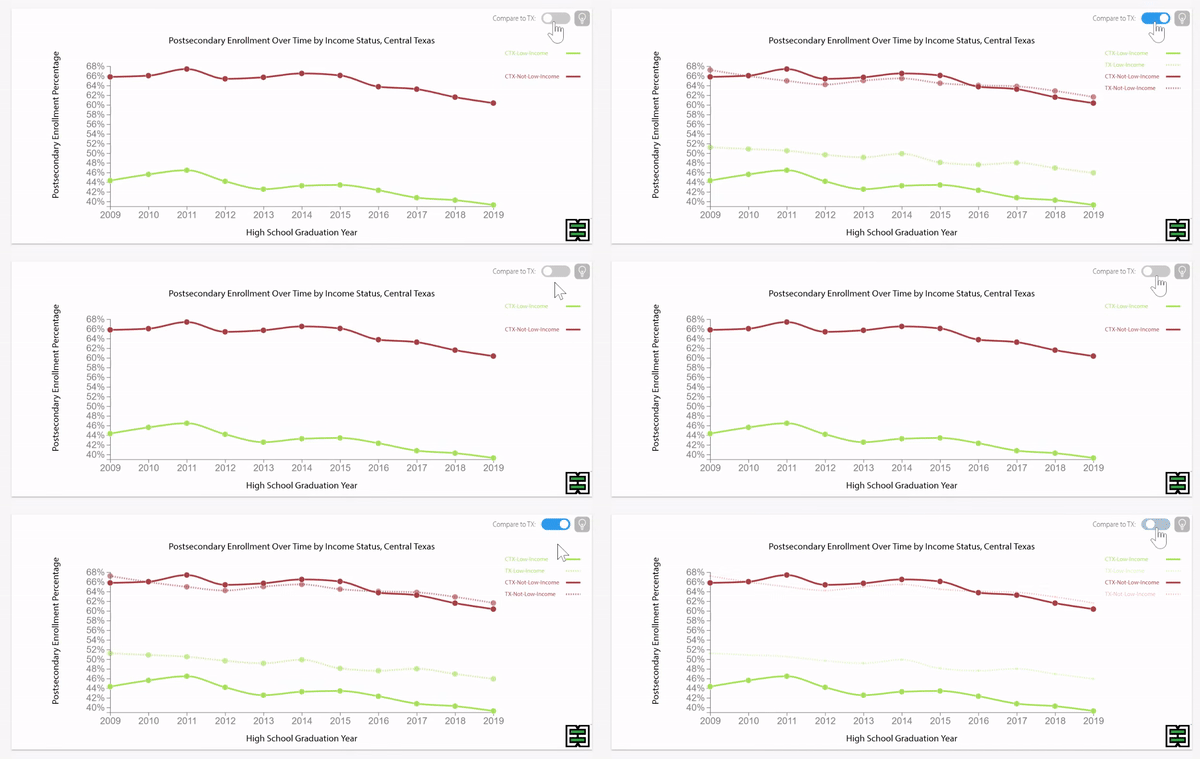
Even as Texas education systems provide more access to college-credit-bearing math, not all students are provided the same opportunities to complete these courses in high school. Disparities in college-credit-bearing math completion rates for students from low-income households compared to students from non-low-income households persist, even as completion rates have increased for both groups over the past ten years.
Use the comparison feature to view the trend in your region as compared to the state.
Disparities in College-Credit-Bearing Math Completion by Race/Ethnicity Persist Over Time
In Texas, all student groups have seen an increase in college-credit-bearing math course completion. Although the trends have been similar across groups, the disparity between the highest completing groups and lowest completing groups has persisted.
Use the comparison feature to look at trends in your region by race over the past 10 years, as compared to the state.
Disparities in College-Credit-Bearing Math Completion by Emergent Bilingual Status Persist Over Time
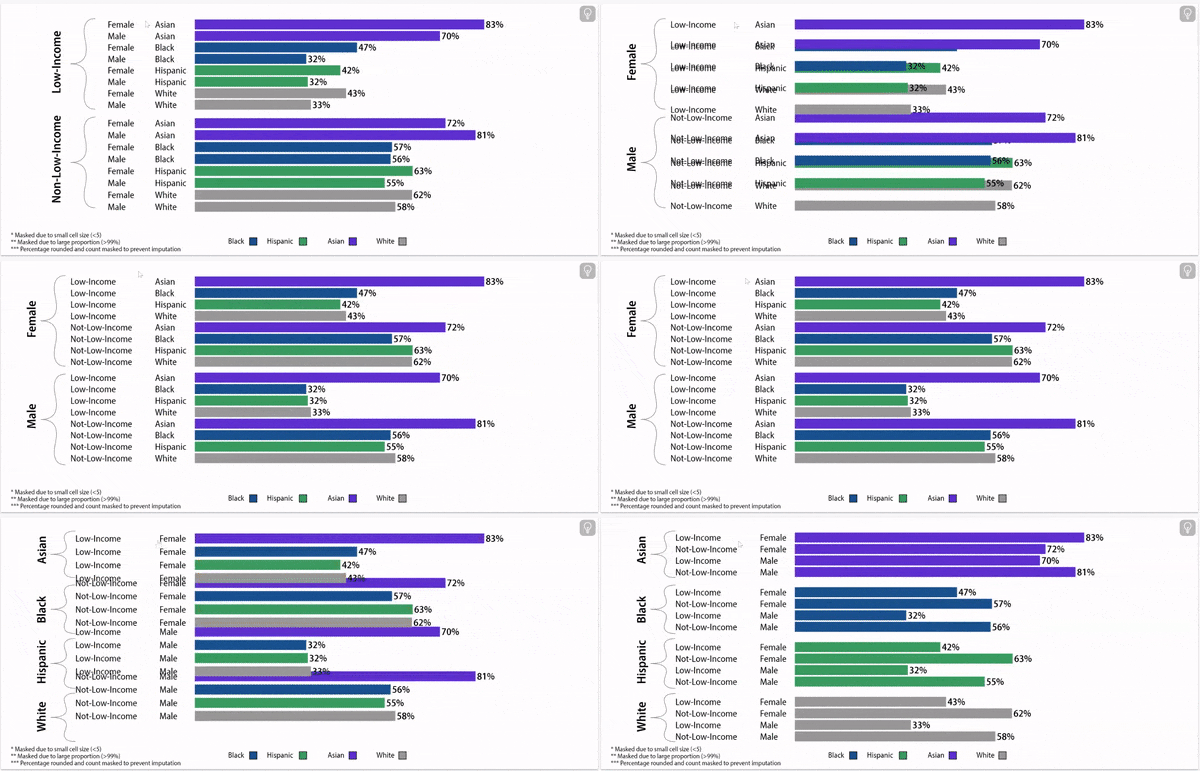
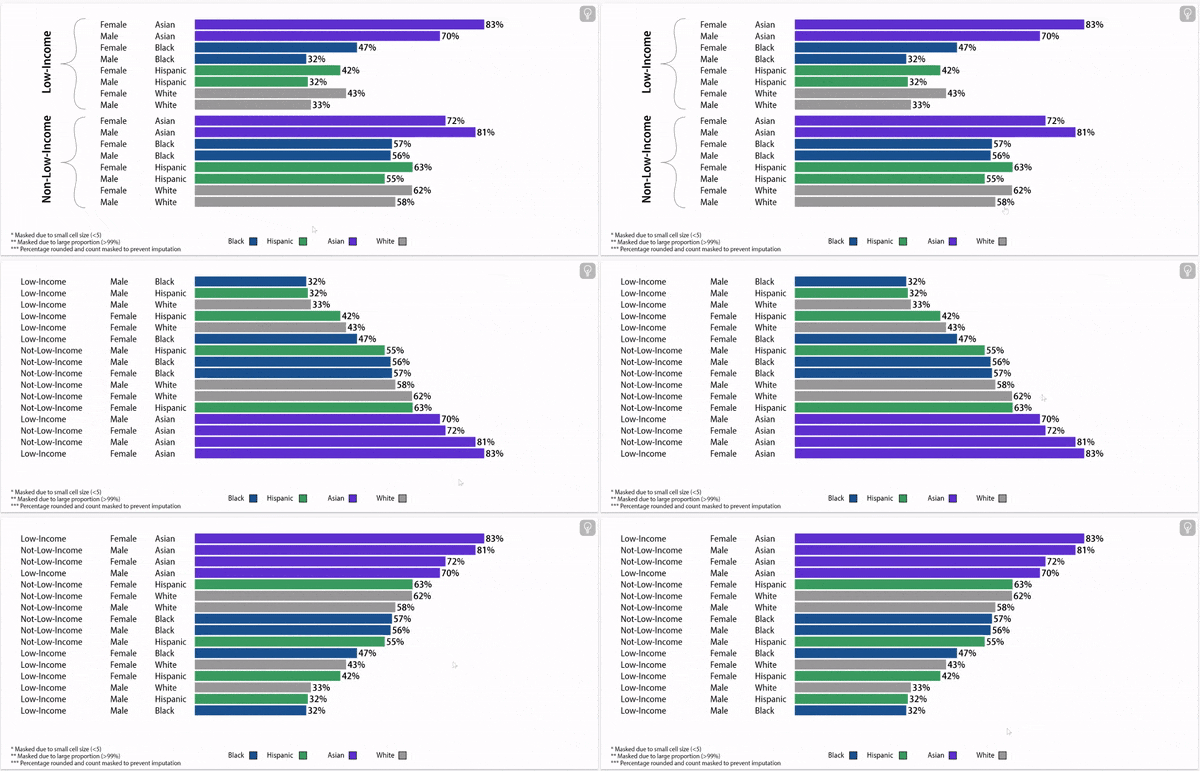
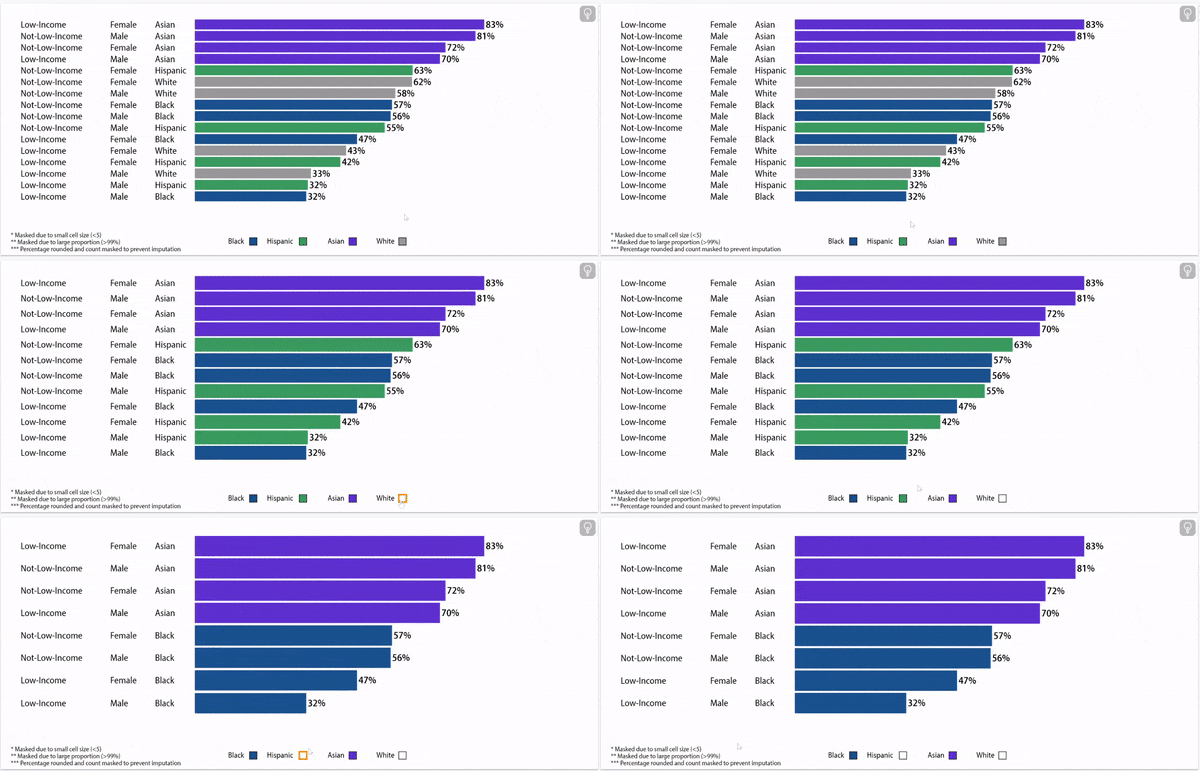
College-Credit-Bearing math completion rates vary by household income status, gender, and race/ethnicity.
College-Credit-Bearing Math Completion Rates, 2024
About this data:
E3 Alliance relies primarily on data from the University of Texas Education Research Center (ERC). This data allows for a longitudinal understanding of high school College-Credit-Bearing math and Algebra II completion based on where and when a student finishes 12th grade. This data pertains to 12th grade students who were enrolled within the state of Texas from grades 9 through 12 over four consecutive school years.
Following are items to note:
The year of the data represents the year of finishing 12th grade. Completion rates reflect whether a student completed College-Credit-Bearing math / Algebra II in Texas between 9th and 12th grades. There is a delay in data availability due to state approval within the ERC and analysis time. As such, if you choose to explore data from Central Texas, the graphs below present College-Credit-Bearing math / Algebra II completion data in the most recent available year in Texas schools.
Cohort: First-time 9th grade students who were in high school for four years
Outcomes that reference data from 2021, 2022, or 2023 do not include San Marcos CISD, due to a data discrepancy.

