Discipline Profile: Central Texas & Texas

Discipline Profile data for
Central Texas & Texas.

Explore:


Choose a Comparison:

Discipline Profile

Disciplinary referrals have a high impact on a student’s educational career. Given that disciplinary referrals may result in the removal of a student from the classroom, examining disciplinary referral distribution patterns is critical to understanding which student populations are disproportionately affected by structural inequities in referral/disciplinary policies. We examine referrals that remove a student from the classroom, such as in-school or out-of-school suspension, expulsion, or placement in a Disciplinary Alternative Education Program (DAEP)/Juvenile Justice Alternative Education Program (JJAEP).

For more information about this data, please click here.

2%

7,502 / 381,268

Central Texas

Disciplinary Referral Rate

5%

249,451 / 5,538,981

Texas

Disciplinary Referral Rate

Disciplinary Referrals Decreasing in Last Decade

Texas has seen an overall downtrend in disciplinary referral rates for the past ten years. The impact of Covid-19 and remote learning also has a visible impact on disciplinary referral rates, which is clear for 2020 as we see the steepest one-year change take place between 2019 and 2020.


Use the comparison feature to see how the trend in your region compares to the state.

Zoom Y-Scale

Disparities Exist in Disciplinary Referrals by Household Income

Household income disparities in referral rates exist in Texas. Education systems in Texas are issuing more disciplinary referrals to students from low-income households than to students from non-low-income households.


In Texas, for the 2019-2020 school year, 1 in 10 students from low-income households were issued at least one disciplinary referral, compared to 1 in 20 students from non-low-income households.


Compare your region to the state by using the comparison feature. Are there greater or lesser disparities in your region?

Disparities in Disciplinary Referrals by Household Income Have Not Decreased in Texas

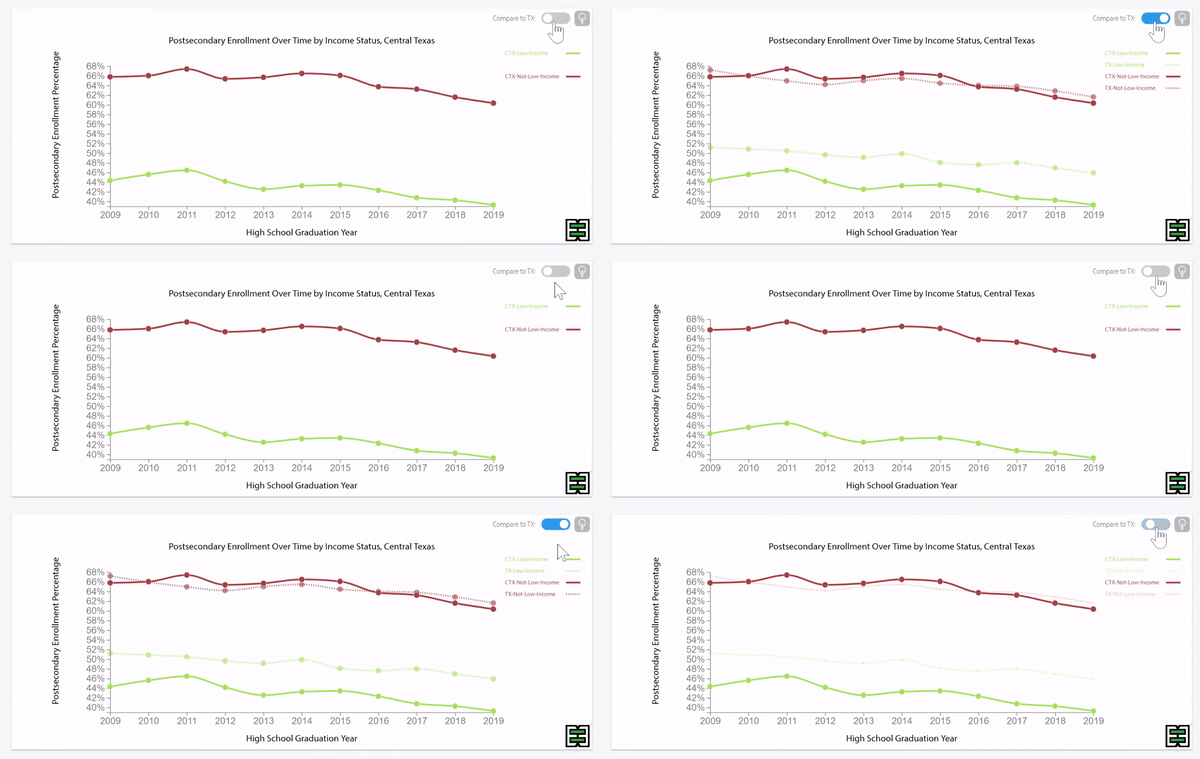
Disciplinary referral rate disparities persist in Texas for students from low-income households as compared to those from non-low-income households. Even as referral rates have decreased for both groups over the past decade, this disparity remains.


For students from low-income households, referral rates decreased from 17% in 2010-2011 to 10% in 2019-2020.


For students from non-low-income households, referral rates decreased from 10% in 2010-2011 to 5% in 2019-2020.


Note: Due to incomplete data in 2019-2020, caution should be exercised when drawing conclusions based on that data.


Use the comparison feature to view the trend in your region as compared to the state. Is the trend moving in the same direction? Are the disparities increasing, decreasing, or remaining the same over time?

Zoom Y-Scale
Compare to :

Disciplinary Referrals Vary by Race

Disciplinary referrals in Texas show racial disparities that point to the need for systemic change.


For the 2019-2020 school year in Texas, education systems referred Black students in Texas at a rate of over ten times more than Asian students (Black - 16%, Asian - 2%).


Use the comparison feature to look at disparities in enrollment in your region. Are disparities larger or smaller than the state?

Disparities in Referrals by Race Persist Over Time

In Texas, all student groups have seen a decrease in disciplinary referral rates. Although the trends have been similar across groups, the disparity between the highest referred groups and lowest referred groups has persisted.


Use the comparison feature to look at trends in your region by race over the past ten years, as compared to the state. Are disparities increasing or decreasing in your region? Do some groups trend in different directions than others?

Zoom Y-Scale
Compare to :

Digging Deeper: Income, Gender, and Race Play a Role in Disciplinary Referrals

Reviewing the latest disciplinary referral data by student groups based on their gender, income, and race allows us to take a closer look at which student groups are being underserved.


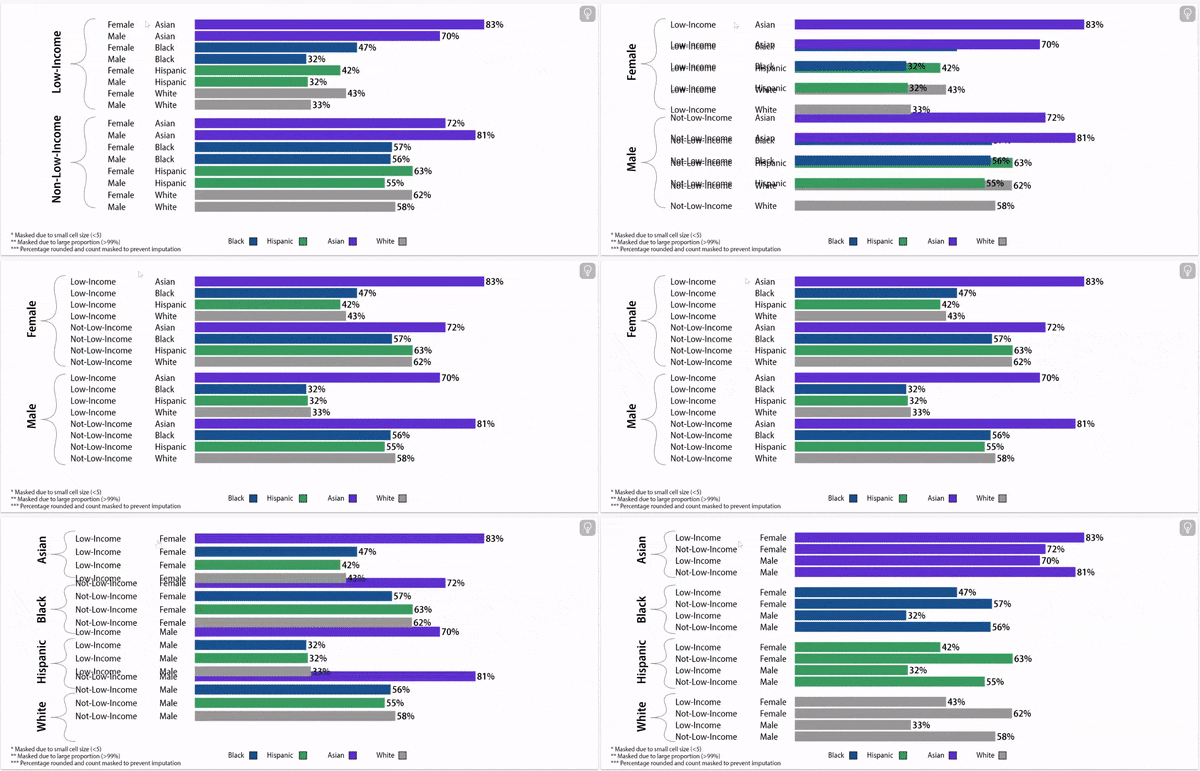
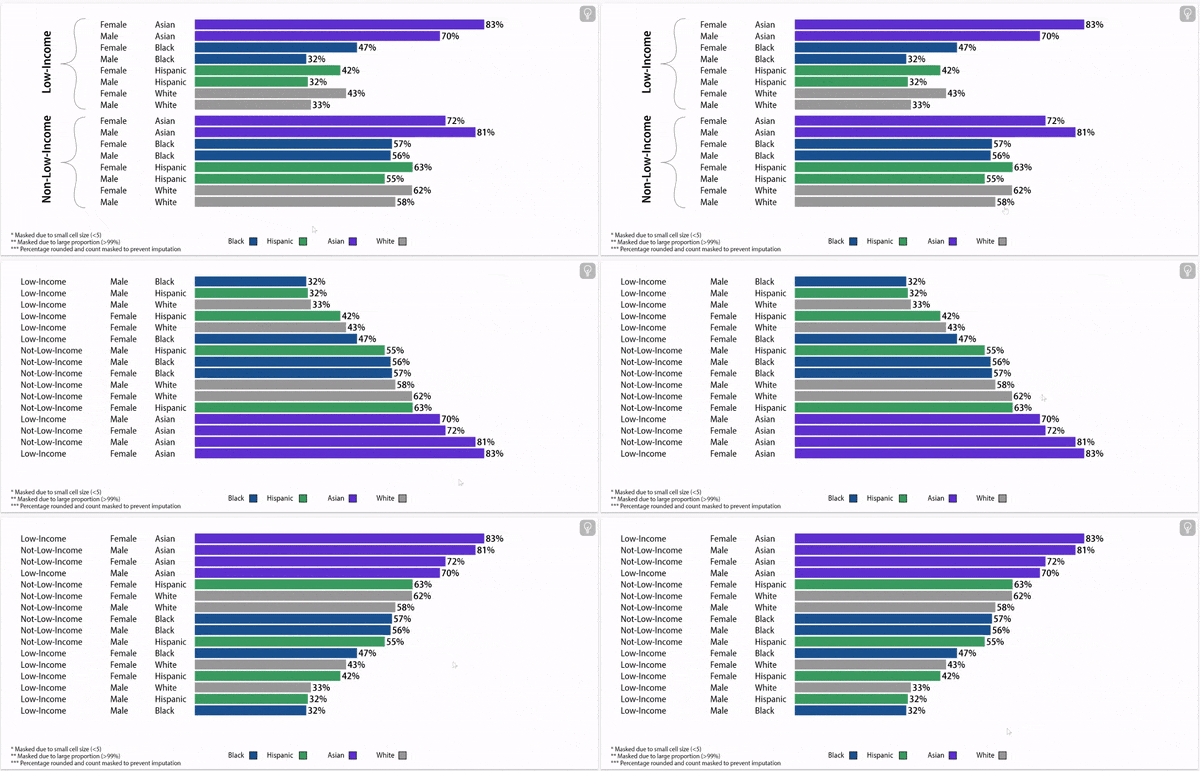
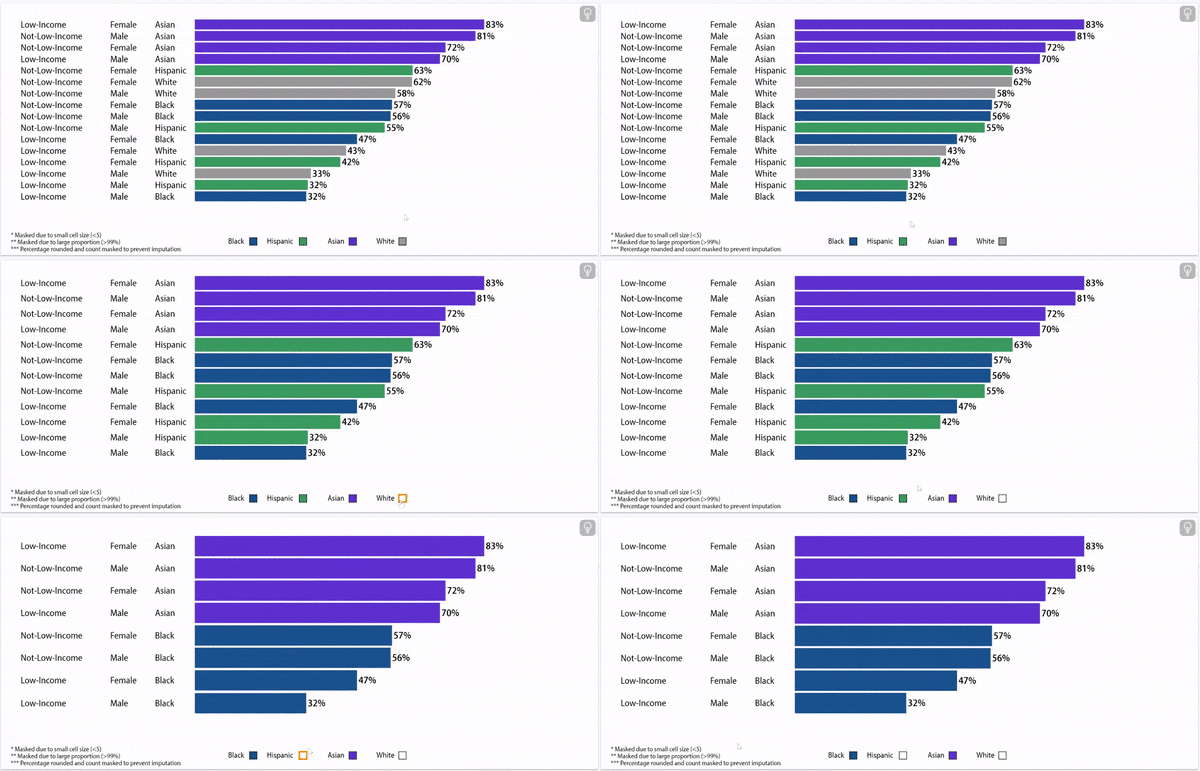
For the 2019-2020 school year in Texas, Asian females from non-low-income households received referrals at the lowest rates (.6%), while Black males from low-income households received referrals at the highest rates (22%).


For almost all racial groups, females from non-low-income households are receiving referrals at the lowest rates, followed by females from low-income households, then males from non-low-income households, and males from low-income households.

Disciplinary Referral Rates, 2021

Compare your District and Campuses to Others Using the Scatterplots Below

Use the first scatterplot below to compare your district to other districts in the region. You can use toggles and selections to look at specific demographic groups, and bright-spot districts. You can also toggle on size indicators and charter districts.


Use the second scatterplot below to compare campuses in your district to other campuses in the region. You can use toggles and selections to look at specific demographic groups, and bright-spot campuses. You can also toggle on size indicators and charter schools within your district.


Gauging your district against your peers can help you benchmark your performance against other similar districts and campuses. You may be surprised to see which districts and campuses perform well for specific demographic groups.

Target Name: Central Texas | Target: CTX

Economic Status

Ethnicity

Gender

About this data:

E3 Alliance relies primarily on data from the University of Texas Education Research Center (ERC). This data allows for a year-by-year understanding of disciplinary referrals based on where a student attends school. This data pertains to Pre-K through 12th grade students who were enrolled within the state of Texas at the end of a given school year.

Following are items to note:

Disciplinary referral rates reflect whether a student received one or more referrals that resulted in removal from a classroom. There is a delay in data availability due to state approval within the ERC and analysis time. As such, if you choose to explore data from Central Texas, the graphs below present disciplinary referral data in the most recent available year in Texas schools.

The conclusions of this research do not necessarily reflect the opinions or official position of the Texas Education Agency, the Texas Higher Education Coordinating Board, or the State of Texas.