School To Work | Career & Technical Education Profile: Central Texas & Texas

School To Work | Career & Technical Education Profile data for
Central Texas & Texas.

Explore:


Choose a Comparison:

School To Work | Career & Technical Education Profile

Career and Technical Education courses offer students the opportunity to gain both challenging academic experience and relevant technical skills that are necessary for postsecondary and career readiness. Examining this data can help identify trends and improve equitable participation and cluster completion.

Jump to: Source and cohort information about this data.

Number of Students that complete a coherent sequence of courses

The graph below shows the number of students who completed an identified CTE cluster. In Texas, Business, Marketing and Finance has the highest completion, while in Central Texas, Health Science was the most popular cluster.

Ag., Food, & Natural ResourcesArchitecture and ConstructionArts, A/V Tech, & CommunicationBusiness, Marketing, & FinanceEducation & TrainingHealth ScienceHospitality & TourismHuman ServicesInformation TechnologyLaw & Public ServiceManufacturingSTEMTrans., Dist., & LogisticsEnergy0.05.0k10k15k20k25k30k35k40k45k50k55kSource: E3 Alliance analysis of CTE data at the UT Austin ERCCentral TexasTexasNumber of Students Completing A Coherent Sequence in Each CTE Cluster, Senior Year Cohort, 2022, Central Texas & TexasNumber of Students2.2k45k3407.8k2.0k31k2.6k57k47011k2.8k49k56012k2907.3k3306.6k98020k28010k2.4k19k3805.3k220

Widget Tips: Vertical-Clustered-Barchart

  • Hover over the bars to view more details in a tooltip.

Cluster Participation in Central Texas and Texas

Although Health Science had the highest number of coherent sequence completions in the Central Texas graduating cohort, the number of students electing to participate in Arts, A/V Tech and Communication as well as Business, Marketing and Finance courses was much higher.

Ag., Food, & Natural ResourcesArchitecture and ConstructionArts, A/V Tech, & CommunicationBusiness, Marketing, & FinanceEducation & TrainingHealth ScienceHospitality & TourismHuman ServicesInformation TechnologyLaw & Public ServiceManufacturingSTEMTrans., Dist., & LogisticsEnergy0.020k40k60k80k100k120k140kSource: E3 Alliance analysis of CTE data at the UT Austin ERCCentral TexasTexasNumber of Students By CTE Cluster, Senior Year Cohort, 2022, Central Texas & TexasNumber of Students6.1k130k1.3k28k7.6k100k7.4k150k1.9k45k7.2k120k2.5k47k2.2k51k2.3k41k4.7k82k1.1k31k5.4k46k96012k710

Widget Tips: Vertical-Clustered-Barchart

  • Hover over the bars to view more details in a tooltip.

CTE Engagement varies vastly by District Type

Note that Non-CTE does note necessarily indicate non-participation, but rather just a lower number of total course semesters completed.

CharterIndependent Town and Other Central CityMajor SuburbanMajor UrbanRural and Other Non-Metropolitan0%10%20%30%40%50%60%70%80%90%100%Non-CTECTE ExplorerCTE ConcentratorOccupational ConcentratorSource: E3 Alliance analysis of CTE data the UT Austin ERCCTE Engagement By District Type, Class of 2022, Central Texas

Widget Tips: Vertical-Stacked-Barchart

  • Hover over the bars to view more details in a tooltip.
  • Click the X-Axis labels to reverse-sort the bars.

Coherent Sequence Completion Rate Continues to climb

As the HS Graduation plans have completely shifted to Foundation School Programs plus Endorsements, both Texas and Central Texas have seen a consistent increase over the last 8 years in Coherent Sequence completion.

Zoom Y-Scale
201220132014201520162017201820192020202120220%10%20%30%40%50%60%70%80%90%100%Coherent Sequence Completion Rate Over Time, By Target, Central Texas & TexasYearPercent of CohortCentral TexasTexas

Widget Tips: Line Chart

  • Hover over the data points to view details.
 
 
Zoom Y-Scale
201220132014201520162017201820192020202120220%10%20%30%40%50%60%70%80%90%100%Completion of One or More CTE Courses Over Time, By Target, Central Texas & TexasYearPercent of CohortCentral TexasTexas

Widget Tips: Line Chart

  • Hover over the data points to view details.

A disparity still exists in CTE Engagement by Income

When looking at CTE Engagement by Income Status in Central Texas, we continue to see that students from Low-Income households have a much higher level of Non-CTE engagement and less than 30% are Occupational Concentrators, completing at least 5 semesters in a single cluster. This is in stark contrast to students that are from Non-Low-Income households.

Low-IncomeNot-Low-Income0%10%20%30%40%50%60%70%80%90%100%Non-CTECTE ExplorerCTE ConcentratorOccupational ConcentratorSource: E3 Alliance analysis of CTE data the UT Austin ERCCTE Engagement By Income Status, Senior Year Cohort, 2022, Central Texas

Widget Tips: Vertical-Stacked-Barchart

  • Hover over the bars to view more details in a tooltip.
  • Click the X-Axis labels to reverse-sort the bars.

CTE Engagement by Race still holds disparities

Although there is still somewhat equitable distribution of CTE Engagement across racial groups, there is a slight disparity in Occupational Concentrators (lower representation) and Non-CTE (higher representation) for Black and Hispanic students as compared to White students. With the wide array of CTE Clusters and pathways within, a deeper look at the CTE Engagement by Race will be needed within each Cluster.

AsianBlackHispanicWhite0%10%20%30%40%50%60%70%80%90%100%Non-CTECTE ExplorerCTE ConcentratorOccupational ConcentratorSource: E3 Alliance analysis of CTE data the UT Austin ERCCTE Engagement By Ethnicity, Senior Year Cohort, 2022, Central Texas

Widget Tips: Vertical-Stacked-Barchart

  • Hover over the bars to view more details in a tooltip.
  • Click the X-Axis labels to reverse-sort the bars.

In Central Texas, Gender representation in the Class of 2020 is consistent

Across the graduating cohort of 2020, the CTE Engagement does appear equitable when Gender is considered. Given the wide array of CTE Clusters and pathways within, each Cluster will need a deeper dive in considering Gender engagement.

FemaleMale0%10%20%30%40%50%60%70%80%90%100%Non-CTECTE ExplorerCTE ConcentratorOccupational ConcentratorSource: E3 Alliance analysis of CTE data the UT Austin ERCCTE Engagement By Gender, Senior Year Cohort, 2022, Central Texas

Widget Tips: Vertical-Stacked-Barchart

  • Hover over the bars to view more details in a tooltip.
  • Click the X-Axis labels to reverse-sort the bars.
 
 
Emergent Bilingual in High SchoolNot Emergent Bilingual in High School0%10%20%30%40%50%60%70%80%90%100%Non-CTECTE ExplorerCTE ConcentratorOccupational ConcentratorSource: E3 Alliance analysis of CTE data the UT Austin ERCCTE Engagement By Emergent Bilingual Status, Senior Year Cohort, 2022, Central Texas

Widget Tips: Vertical-Stacked-Barchart

  • Hover over the bars to view more details in a tooltip.
  • Click the X-Axis labels to reverse-sort the bars.


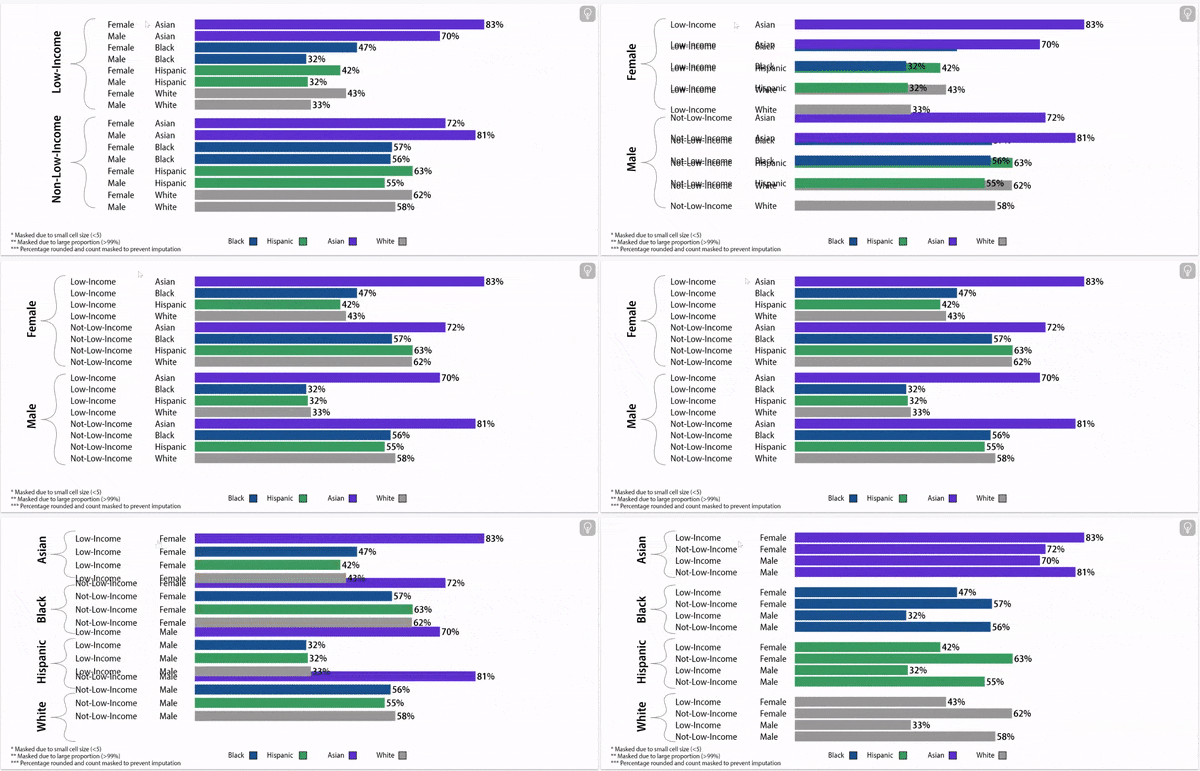
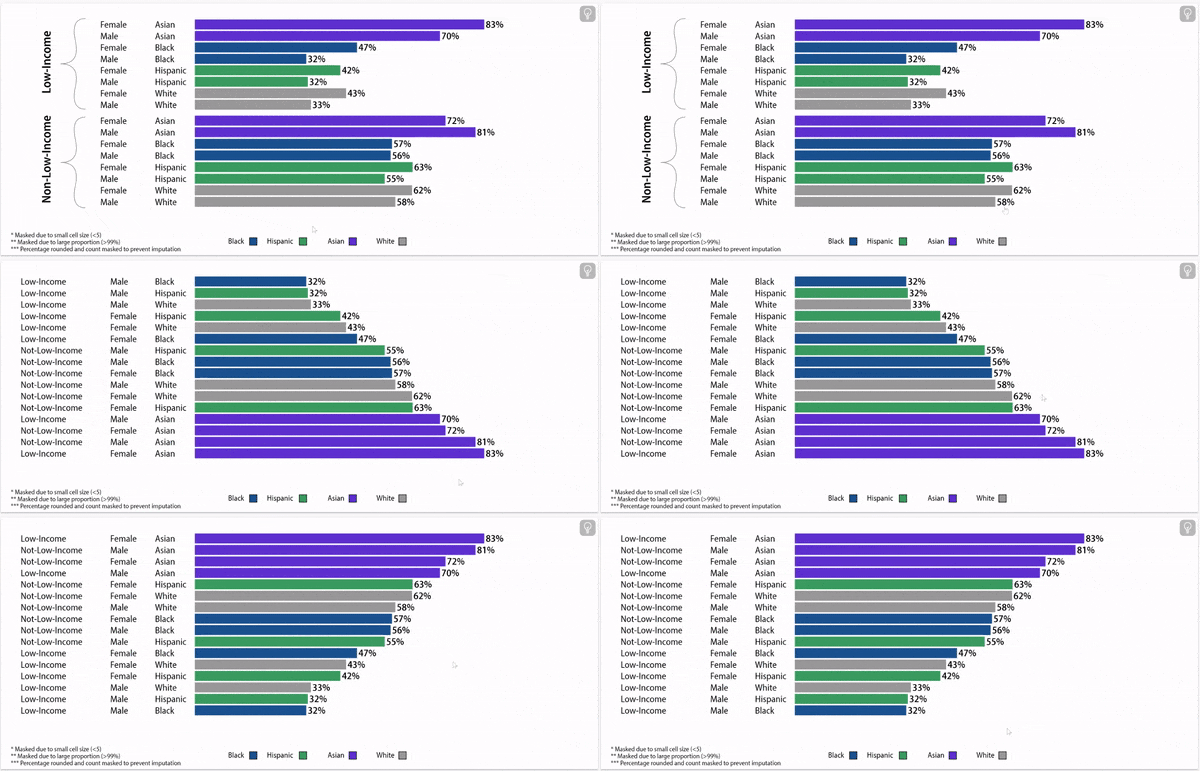
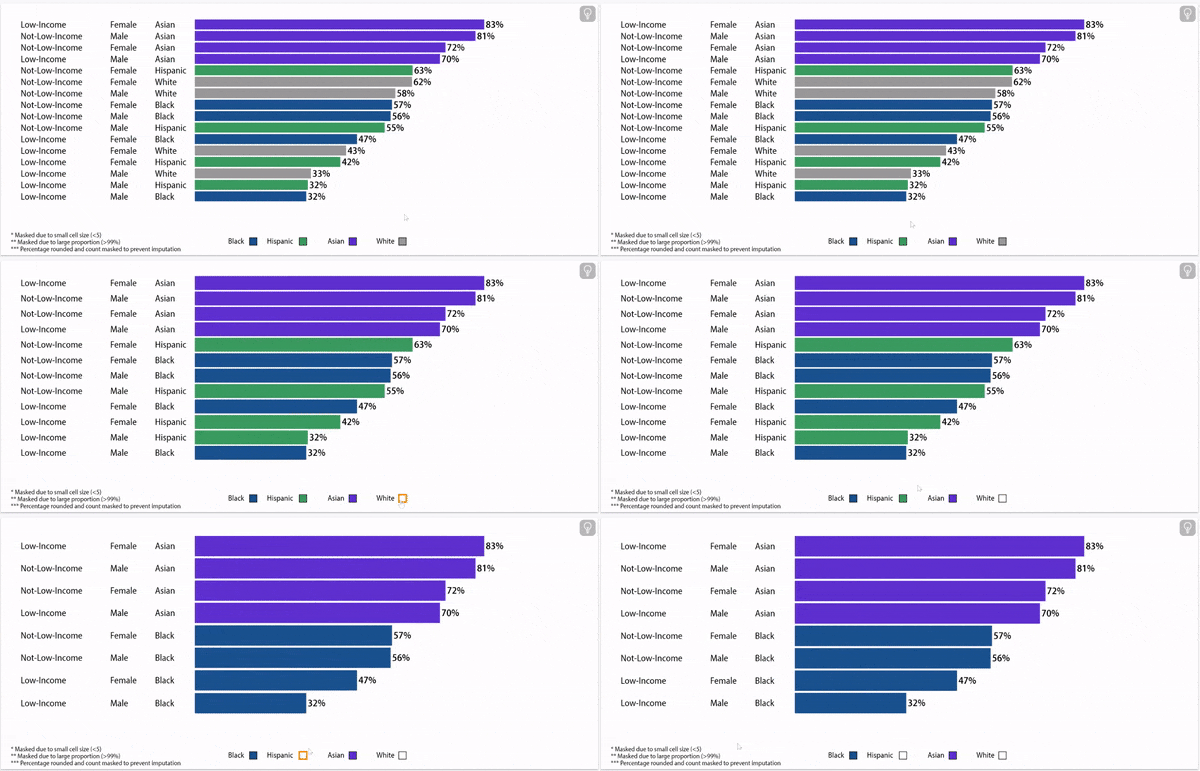
Percent of High School Graduates with an Occupational Concentration, Class of 2022, Central Texas

Widget Tips: Sixteen-Way-Chart

  • Click on the student-group labels to restructure the chart.
  • Click on the percent (rate) labels to sort the chart.
  • Click on the legend-squares to toggle on/off a student-group.
Low-IncomeNon-Low-IncomeBlackHispanicAsianWhite*** Percentage rounded and count masked to prevent imputation (the true percentage is within ± 5 percentage points of the value shown) ** Masked due to large proportion (fewer than five students did NOT have this outcome) * Masked due to small cell size (fewer than five students had this outcome) 51%

About this data:

E3 Alliance relies primarily on data from the University of Texas Education Research Center (ERC). This data allows for a longitudinal understanding of CTE engagement and completion, based on where and when a student graduates from high school. This data pertains to graduates from within the state of Texas who participated in Career and Technical Education courses while in high school.

Following are items to note:

The data represents the year the students graduated from high school. There is a o lapse and delay in the data due to the state's release of the data and time needed to analyze the data. Therefor, the graphs below present CTE Participation and completion from the 2020 graduating class of students.

The TEA defines a coherent sequence of four or more courses that consists of at least two courses in the same career cluster. To help analyze the data, the E3 Alliance defines CTE engagement as:

• Non-CTE: Student completed 0-2 semesters in CTE
• CTE Explorer: Student completed 3-4 semesters in CTE
• CTE Concentrator: Student completed >=5 semesters in CTE, but <5 semesters in any given cluster
• Occupational Concentrator: Student completed >=5 semesters in a single cluster
• Completing a coherent sequence of CTE courses is a key aspect of completing an Endorsement for HS Graduation in Texas.

Note that Non-CTE does note necessarily indicate non-participation, but rather just a lower number of total course semesters completed.


Cohort: First-time 9th grade students who graduate within four years, including students who transfer in


Outcomes that reference data from 2021, 2022, or 2023 do not include San Marcos CISD, due to a data discrepancy.

The conclusions of this research do not necessarily reflect the opinions or official position of the Texas Education Agency, the Texas Higher Education Coordinating Board, or the State of Texas.