Postsecondary Persistence Profile
Jump to: Source and cohort information about this data.
2020-21
85%
8,218 / 9,723
Central Texas
Postsecondary Persistence Rate
2020-21
81%
31,225 / 38,335
Dallas/Fort Worth
Postsecondary Persistence Rate
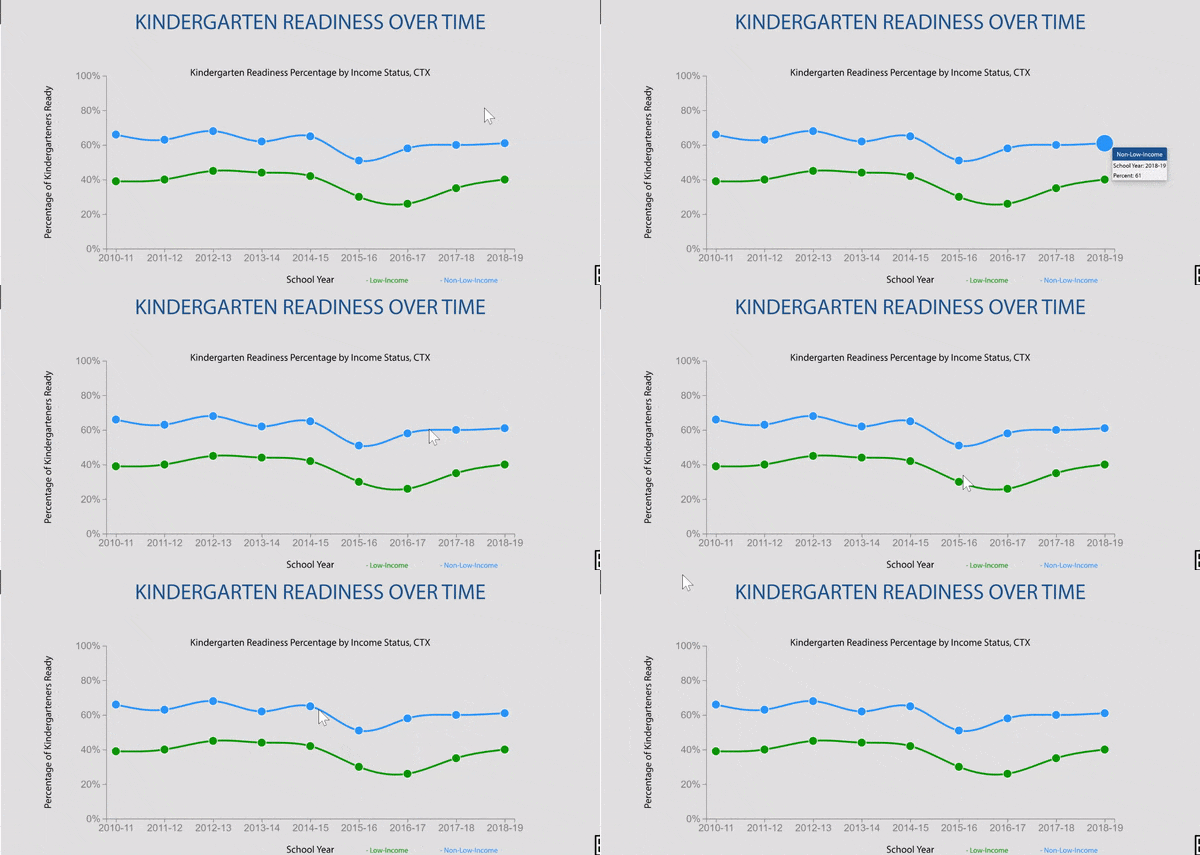
Despite fluctuations, Texas postsecondary persistence rates have remained largely unchanged.
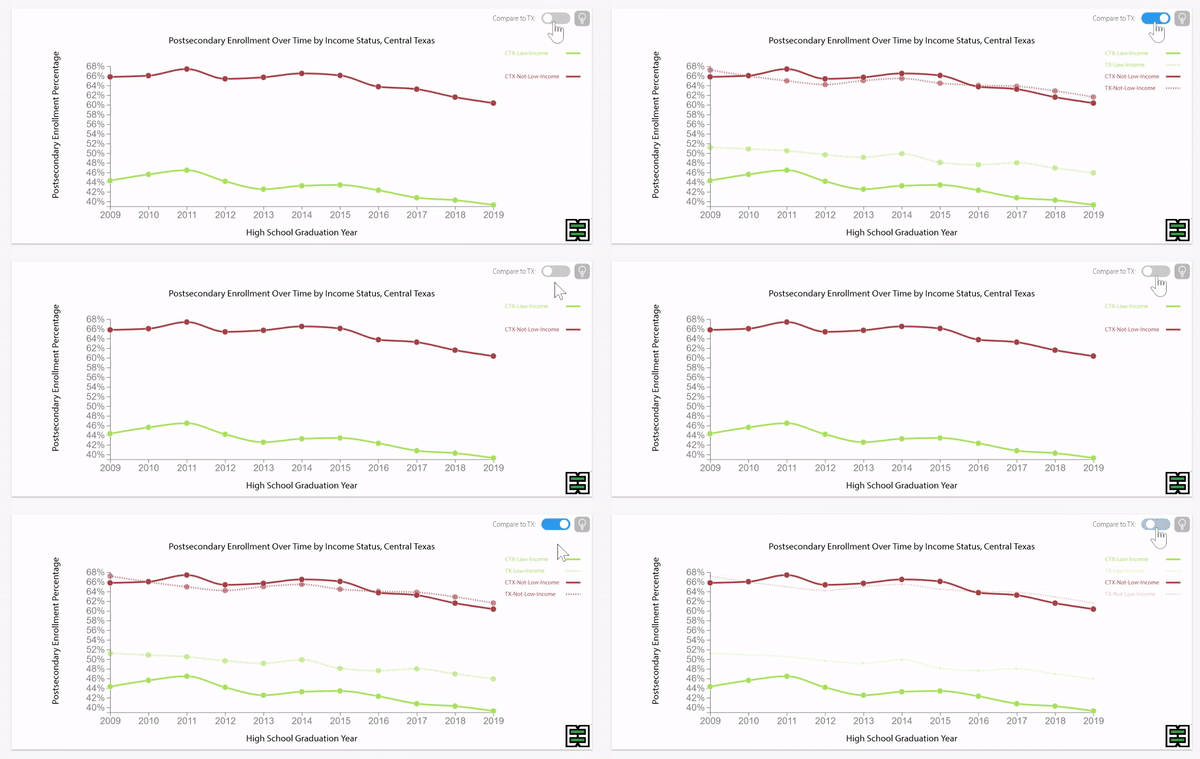
Disparities exist in postsecondary persistence by household income status.
Despite fluctuations, disparities in postsecondary persistence rates by household income in Texas have remained largely unchanged.
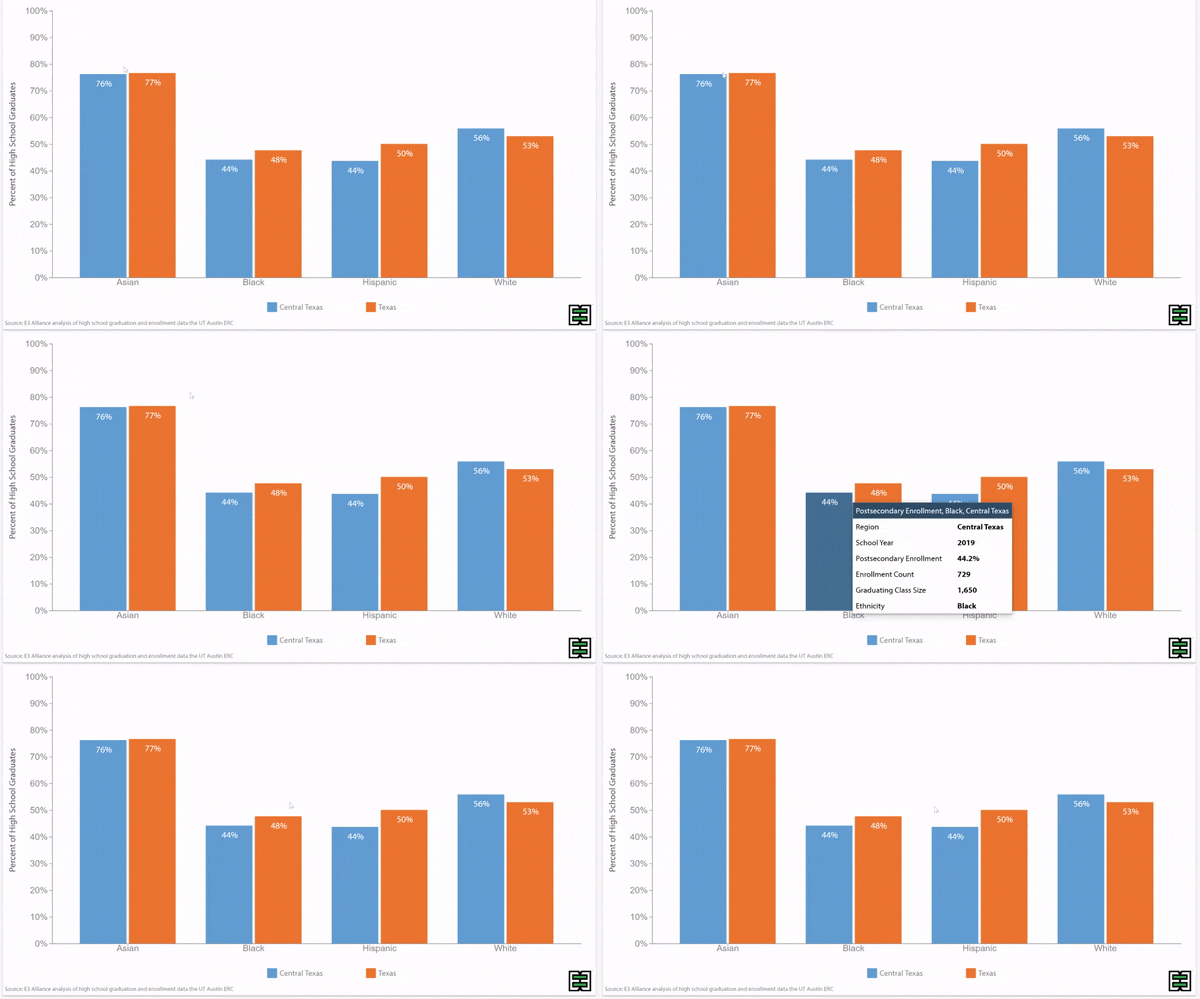
Postsecondary persistence rates vary by race/ethnicity.
Postsecondary persistence rates vary by emergent bilingual status.
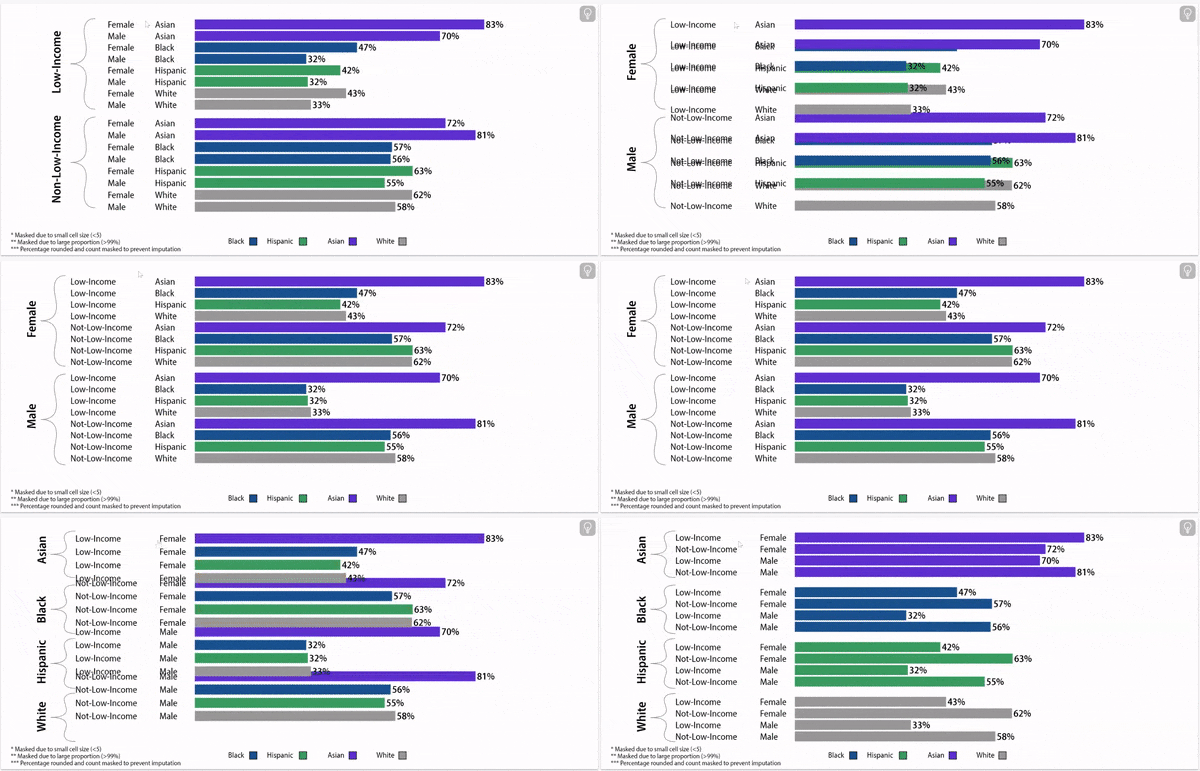
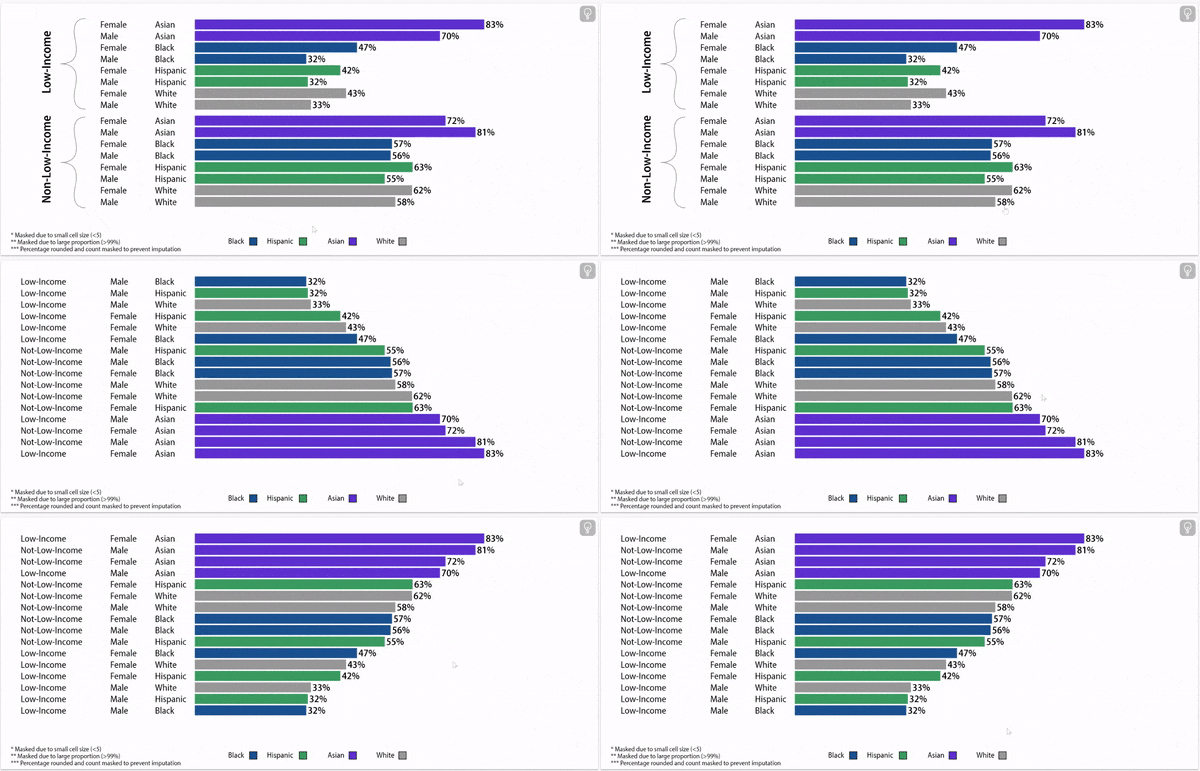
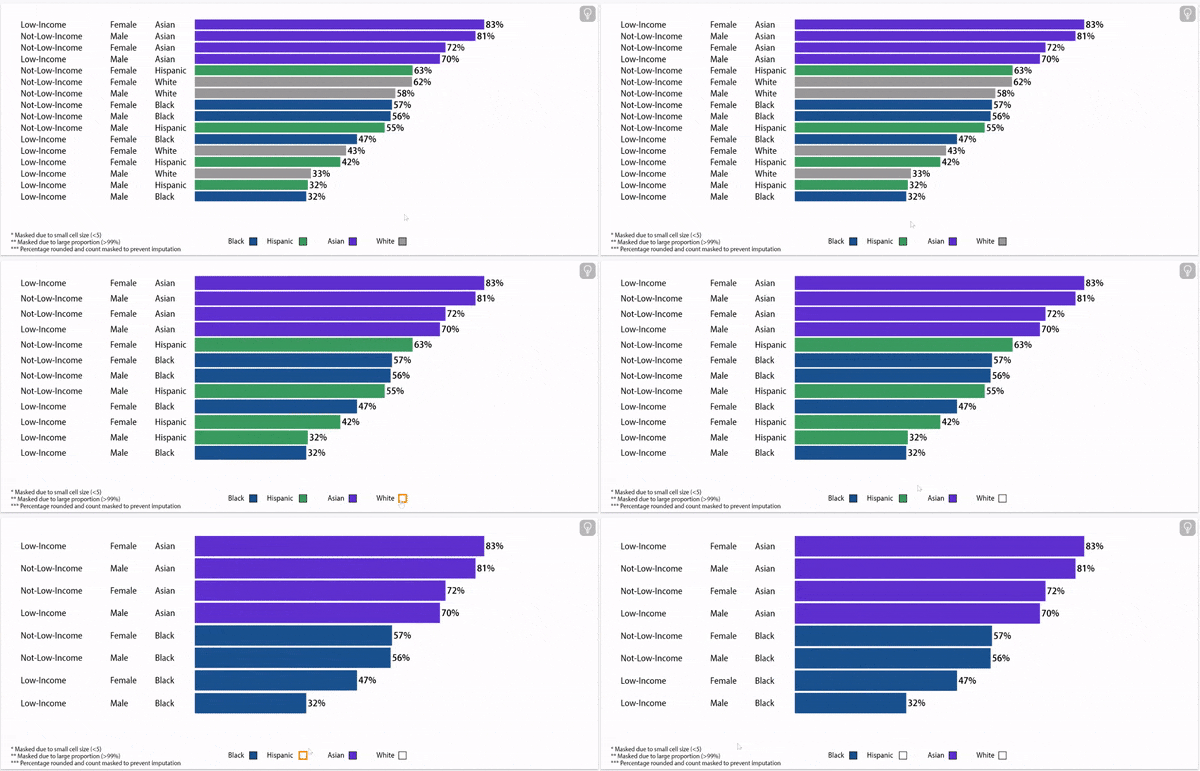
Postsecondary persistence rates vary by household income status, gender, and race/ethnicity.
Postsecondary Persistence Rates, 2021
About this data:
E3 Alliance relies primarily on data from the University of Texas Education Research Center (ERC). This data allows for a longitudinal understanding of postsecondary enrollment, persistence, and completion, based on where and when a student graduates from high school. This data pertains to graduates from within the state of Texas who enroll in Texas postsecondary institutions within one year of graduating from high school.
Following are items to note:
The year of the data represents the year of high school graduation.
Measuring persistence requires two years to elapse (one year to enroll, and one year to return). The data above shows the 2021 postsecondary persistence status of the class of 2019.
Cohort: First-time 9th grade students who graduate within four years, including students who transfer into Texas public schools
Outcomes that reference data from 2021, 2022, or 2023 do not include San Marcos CISD, due to a data discrepancy.

