Postsecondary Enrollment Profile: Rio Grande Valley & Texas

Postsecondary Enrollment Profile data for
Rio Grande Valley & Texas.

Explore:


Choose a Comparison:

Postsecondary Enrollment Profile

Enrolling in an institution of higher education (both two and four-year) is a critical first step on the path to postsecondary success. Through examining disaggregated data, interventions can be identified to help improve equitable enrollment in institutions of higher education.

For more information about this data, please click here.

52%

11,426 / 21,970

Rio Grande Valley

Postsecondary Enrollment Rate

49%

160,150 / 328,761

Texas

Postsecondary Enrollment Rate

Postsecondary Enrollment Within One Year of Graduation Decreasing in Last Decade

While high school graduation rates have been increasing over the past ten years for Texas, the same trend is not found in postsecondary enrollment in Texas institutions in the first year after graduation, where rates have been decreasing steadily.


In Texas overall, enrollment rates decreased from 61% of the class of 2009 to 49% of the class of 2020. For the first time in a decade, less than 1/2 of Texas graduates were enrolling in Texas postsecondary institutions within 1 year of graduation.


Use the comparison feature to see how the trend in your region compares to the state.

Zoom Y-Scale

Disparities Exist in Postsecondary Enrollment by Household Income

There are disparities in postsecondary enrollment by household income in Texas. More students from non-low-income households enroll in postsecondary education than students from low-income households.


In Texas, for the class of 2020, about 4 in 10 students from low-income households enrolled in Texas postsecondary institutions within one year of high school graduation, compared to 6 in 10 students from non-low-income households.


Use the comparison feature to compare your region to the state. Are there greater or lesser disparities in your region?

Texas' Two-Year Colleges More Popular Among Graduates from Low-Income Households

Texas has a variety of institutions of higher education, including, two-year public colleges, four-year public colleges, and four-year private institutions.


In Texas, for the class of 2020 who enrolled in college within one year of high school graduation, more than half of graduates from low-income households enrolled in two-year public institutions, while nearly 7 of 10 graduates from non-low-income households enrolled in four-year public institutions.


Use the left hand menu to explore your region. What institutions are students from your region enrolling in? How does it compare to the state?

Disparities in Postsecondary Enrollment by Household Income Have Not Decreased in Texas

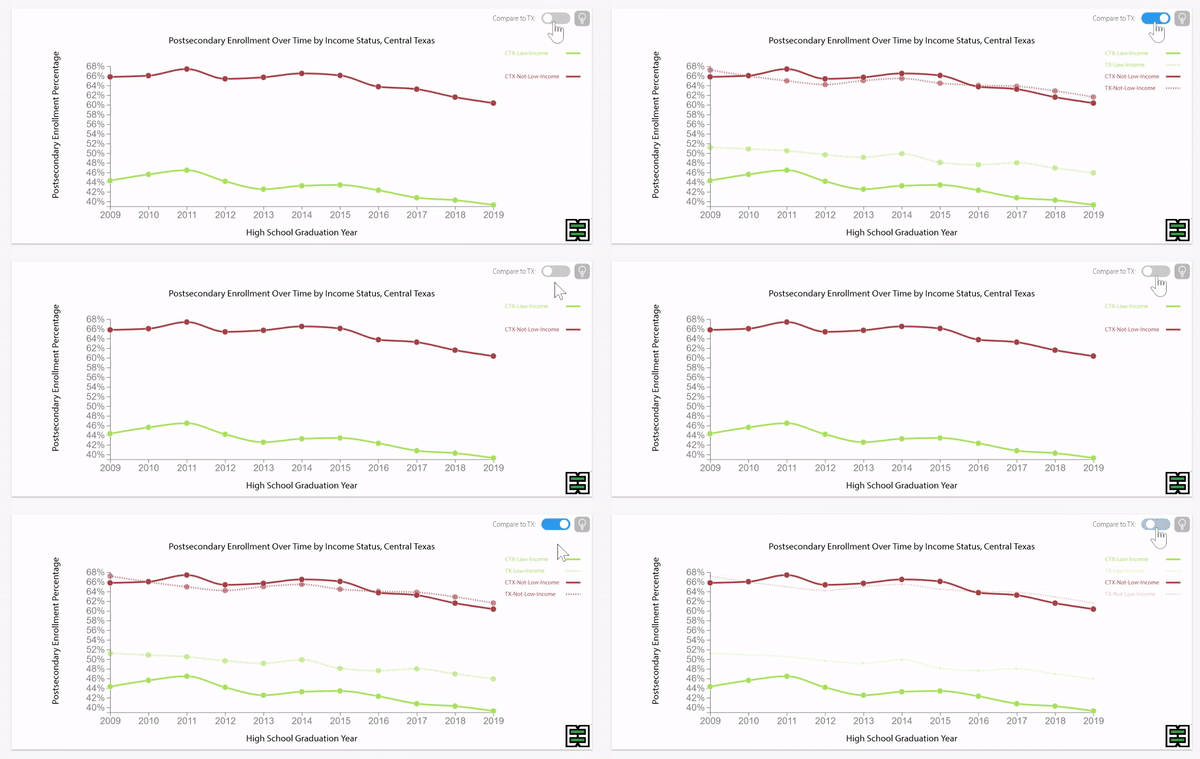
Disparities continue in postsecondary enrollment rates within one year of high school graduation for students from low-income households as compared to students from non-low-income households in Texas. Even as enrollment rates have decreased for both groups over the past 10 years, this disparity persists.


For students from low-income households, postsecondary enrollment rates within one year of graduation decreased from 52% for the class of 2009 to 42% for the class of 2020.


For students from non-low-income households, enrollment rates decreased from 69% for the class of 2009 to 61% for the class of 2020.


Use the comparison feature to view the trend in your region as compared to the state. Is the trend moving in the same direction? Are the disparities increasing, decreasing, or remaining the same over time?

Zoom Y-Scale
Compare to :

Postsecondary Enrollment Within One Year of Graduation Varies by Race

Enrollment patterns in Texas postsecondary institutions show racial disparities that point to the need for systemic change around opportunities, access, and support.


Use the comparison feature to look at disparities in enrollment in your region. Are disparities larger or smaller than the state?

Disparities in Postsecondary Enrollment by Race Persist Over Time

In Texas, all student groups have seen a decrease in postsecondary enrollment in Texas institutions of higher education within one year of graduating high school. Although the trends have been similar across groups, the disparities have persisted.


Use the comparison feature to look at trends in your region by race over the past 10 years, as compared to the state. Are disparities increasing or decreasing in your region? Do some groups trend in different directions than others?

Zoom Y-Scale
Compare to :

Digging Deeper: Gender, Income, and Race Play a Role in Postsecondary Enrollment Rates

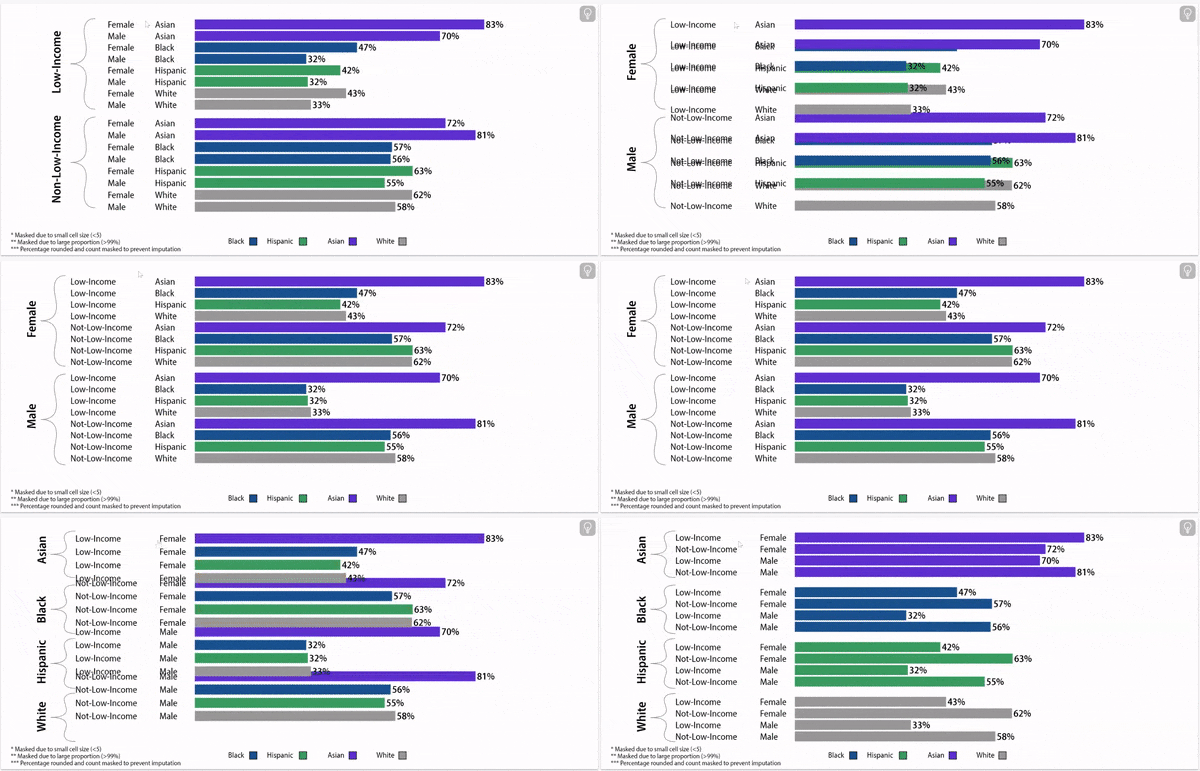
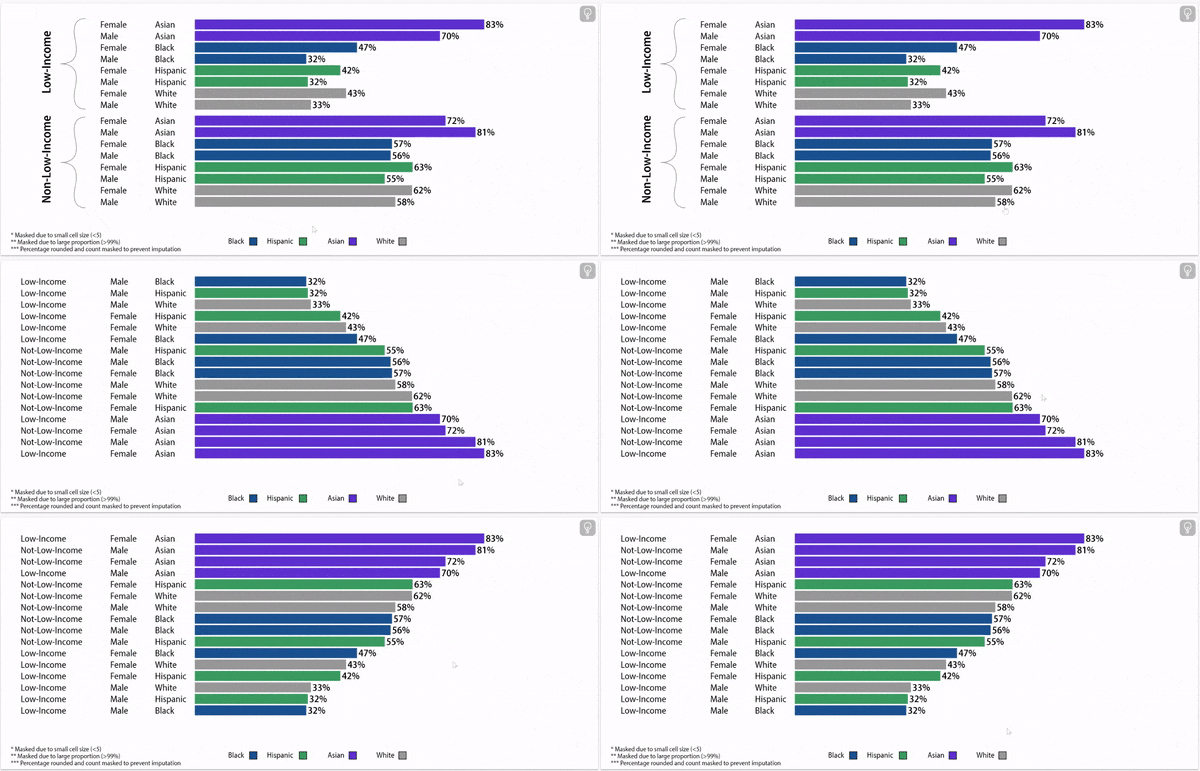
Reviewing the latest enrollment data by student groups based on their gender, income, and race allows us to take a closer look at which student groups are being underserved.


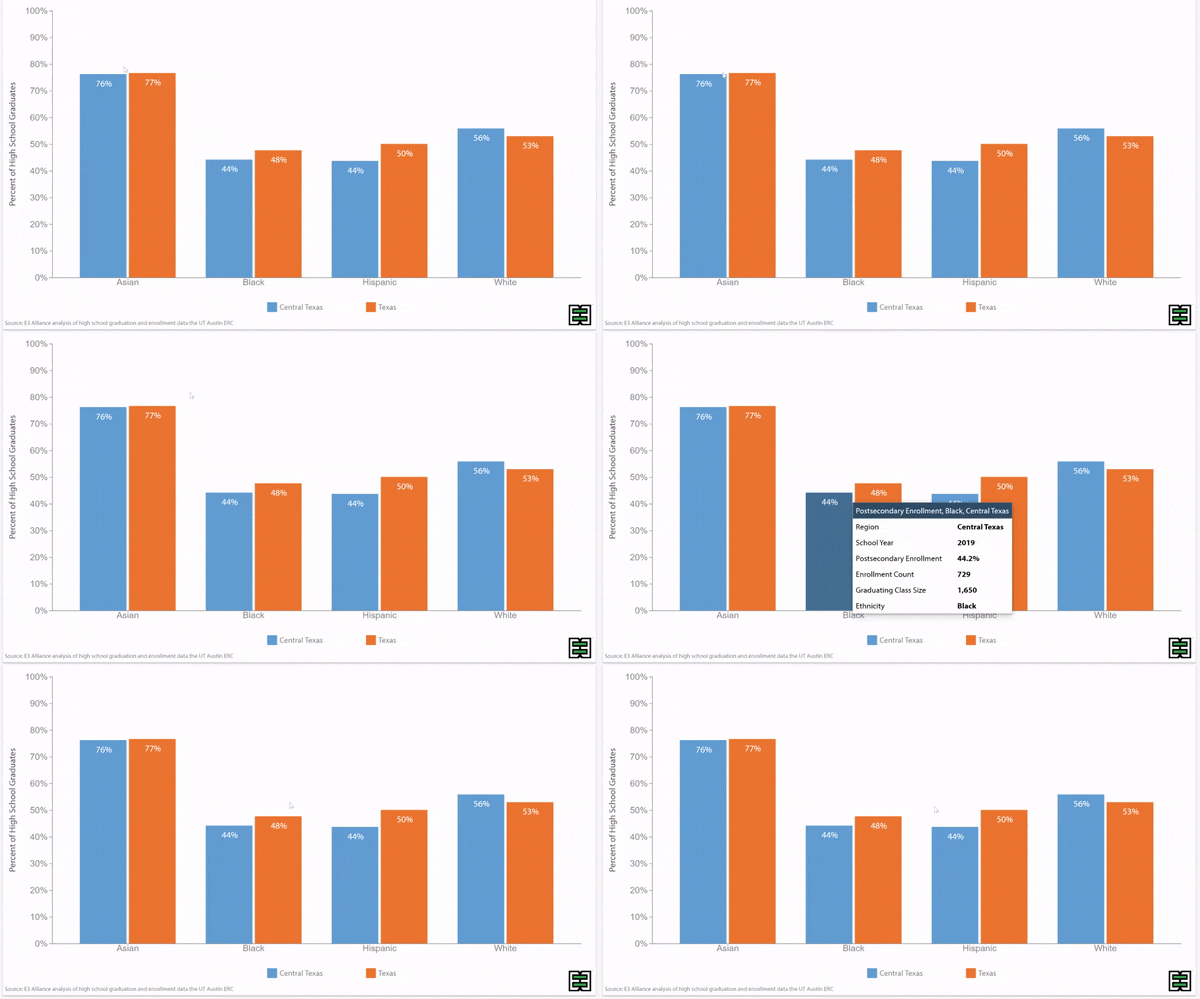
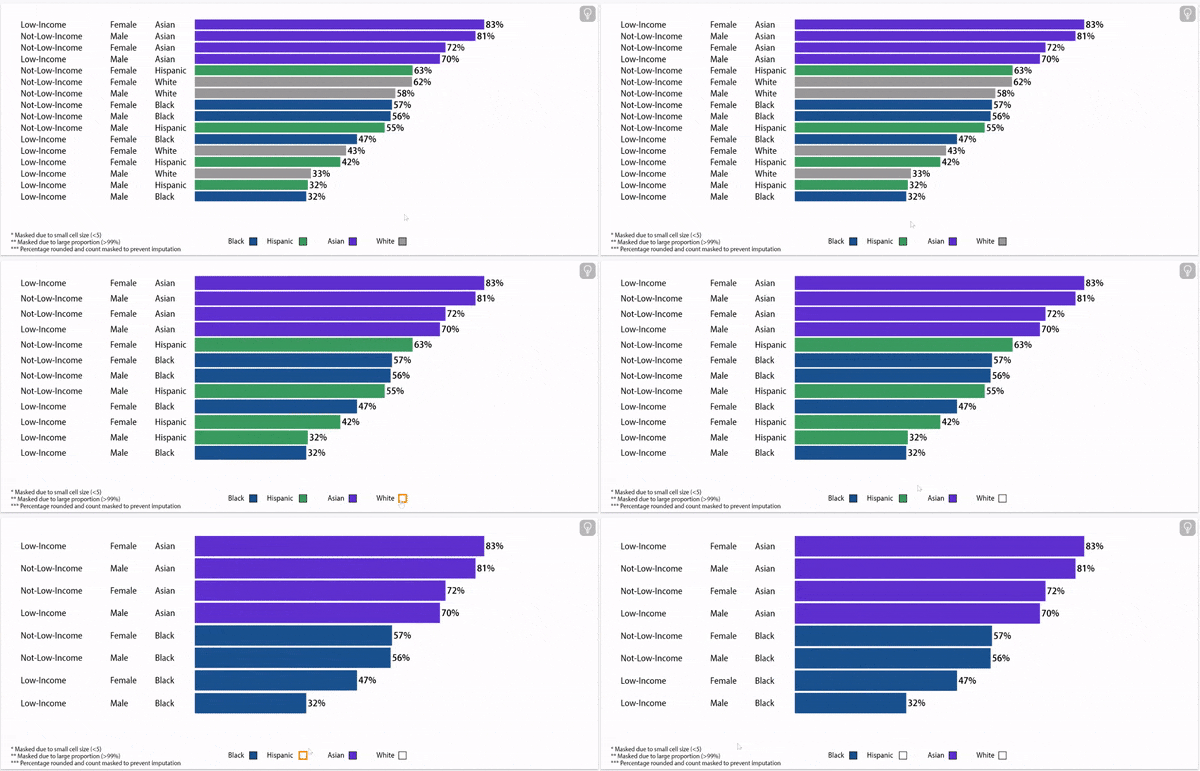
In Texas for the class of 2020, Asian females from non-low-income households enrolled in Texas postsecondary institutions within one year of graduation at the highest rates (78%), while white males from low-income households enrolled in Texas postsecondary institutions within one year of graduation at the lowest rates (29%).


For nearly all racial groups, females from non-low-income households are enrolled at the highest rates, followed by males from non-low-income households, then females from low-income households, and males from low-income households.

High School Grads Enrolling in Texas Higher Education, Class of 2020

Compare your District and Campuses to Others Using the Scatterplots Below

Use the first scatterplot below to compare your district to other districts in the region. You can use toggles and selections to look at specific demographic groups, and bright-spot districts. You can also toggle on size indicators and charter districts.


Use the second scatterplot below to compare campuses in your district to other campuses in the region. You can use toggles and selections to look at specific demographic groups, and bright-spot campuses. You can also toggle on size indicators and charter schools within your district.


Gauging your district against your peers can help you benchmark your performance against other similar districts and campuses. You may be surprised to see which districts and campuses perform well for specific demographic groups.

Target Name: Rio Grande Valley | Target: RGV

Economic Status

Ethnicity

Gender

Target Name: Rio Grande Valley | Target: RGV

Economic Status

Ethnicity

Gender

About this data:

E3 Alliance relies primarily on data from the University of Texas Education Research Center (ERC). This data allows for a longitudinal understanding of postsecondary enrollment, persistence, and completion, based on where and when a student graduates from high school. This data pertains to graduates from within the state of Texas who enroll in Texas postsecondary institutions within one year of graduating from high school.

Following are items to note:

The year of the data represents the year of high school graduation. There is a delay in the data due to the state's approval process and the time needed to measure postsecondary enrollment after graduation. The graphs below present postsecondary enrollment data in the most recent available year in Texas postsecondary institutions, for the class that graduated high school in 2020.

The conclusions of this research do not necessarily reflect the opinions or official position of the Texas Education Agency, the Texas Higher Education Coordinating Board, or the State of Texas.