Kindergarten Literacy Assessment: Rio Grande Valley & San Antonio

Kindergarten Literacy Assessment data for
Rio Grande Valley & San Antonio.

Explore:


Choose a Comparison:

Kindergarten Literacy Assessment

The success of any education system can be measured by how well it equips its youngest learners with the tools they need to excel in the class room and beyond. Access to evidence-based supports for early learning like full-day, low-ratio Pre-kindergarten, high quality child care, and home visiting programs is linked to future academic success. This is important for communities because systems that support students who are prepared for school will help students develop foundational skills that allow learning to expand in elementary school, develop in middle and high school, and continue into the workforce.

Evidence-based initiatives such as full-day, low-ratio pre-kindergarten programs, high-quality child care, and home visiting programs play a critical role in preparing students for future academic success. Early mastery of essential skills lays a solid foundation for children's academic and professional journey throughout elementary, middle, and high school, benefiting not only the students but also the broader community. As part of this early preparation, the kindergarten literacy assessment serves as a vital system-level tool to ensure that young children are ready to tackle the challenges of primary education, setting them on a path towards academic achievement and overall success.

E3 Alliance historically used a well-established kindergarten readiness assessment to evaluate Central Texas’ ability to support early learning in multiple domains. During the 2020-2021 school year, the Texas Education Agency (TEA) limited the assessments that educators to using two literacy-focused assessments. While current assessments are less comprehensive and less sensitive to measuring educational inequities, early literacy results show consistent trends about systemic barriers to student success.

The state of Texas historically used several assessments designed to measure a child's skills and behaviors within the first few weeks of entering kindergarten. Currently, the Texas Kindergarten Entry Assessment (TX-KEA) from the Children’s Learning Institute (CLI) and Texas mCLASS (M-CLS) from DIBELS (another set of procedures and measures used for assessing literacy skills) are the only assessments accepted for official reporting purposes by TEA. Studying results from kindergarten literacy assessments provides a deeper understanding as to how to better serve students during their early years and build equitable education systems.

For more information about this data, please click here.

44%

8,390 / 19,232

Rio Grande Valley

Meets K-Readiness Standard on Literacy Assessment

45%

12,968 / 28,709

San Antonio

Meets K-Readiness Standard on Literacy Assessment

Access and Supports for Pre-Kindergarten Attendance Boost Early Literacy Rates

Evidence has consistently shown the value of quality pre-K for preparing students for future academic success, particularly students who have been historically excluded from formal early learning opportunities. In 2019, HB3 was passed, requiring all Texas school districts to offer full-day pre-K to all eligible four-year-olds. While pre-K programs differ in other important aspects of quality, such as student-to-staff ratios, evidence shows that providing full-day pre-K is a policy that enhances access to early learning.


The charts below show the difference that access to pre-K makes for students from low-income households, as measured by the TX-KEA and M-CLS assessments. Both assessments show that when students from low-income households have the access and support to attend pre-K, they have a better likelihood of entering kindergarten ready to succeed.

Texas Education Systems Must do More to Prepare Students From Low-Income Households for Early Learning

The graph below shows the percent of students by household income who met the kindergarten-readiness standard from their literacy assessment held at the start of school.


Note the impact on outcomes for students from low-income and non-low-income households. Access to high-quality early learning, whether through full-day, low-ratio public pre-K, high quality child care, or home visiting programs, clearly closes the equity gap between groups.

The following two graphs show how the two different TEA-approved assessments measure disparities in kindergarten literacy by household income. The graph on the left shows the outcomes for the TX-KEA assessment and the graph on the right shows the outcomes for the M-CLS. While the two assessments have different sensitivity levels for their measure of readiness for early literacy, both show the need for systemic investments to better support students from low-income households.

What differences do you see by region compared to the state, by income, and/or by assessment type? How do these differences compare with your experience in early learning systems?

Texas Education Systems Must do More to Support and Include Students who Have Been Traditionally Excluded From Formal Early Learning Opportunities

Exclusionary education policies have reduced the access and support to early learning opportunities for communities of color. We see the legacy and impact of these policies by reviewing readiness assessment scores for communities of color, as compared to White students in Texas.


Use the comparison feature to look at disparities in your region. Are disparities larger or smaller than the state? What policies or practices could you put in place to increase early literacy in communities traditionally excluded from those opportunities?

The following two graphs show how the two different TEA-approved assessments measure disparities in kindergarten literacy by race. The graph on the left shows the outcomes for the TX-KEA assessment and the graph on the right shows the outcomes for the M-CLS. Again, the assessments show similar trends, but different sensitivities for identifying students in need of additional early literacy supports.

What impact in outcomes do you see by region compared to the state, by race, and/or by assessment type?

Digging Deeper: Students' Access to Early Learning Supports Differs Depending on Gender, Income, and Race

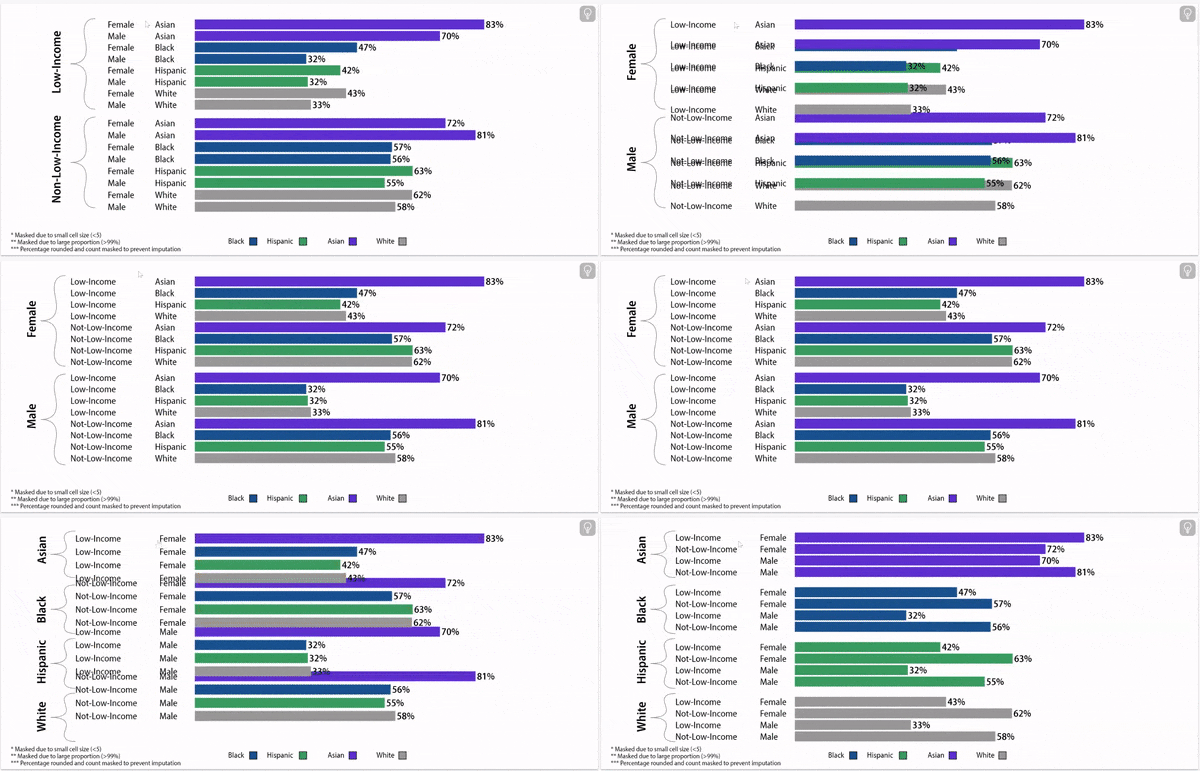
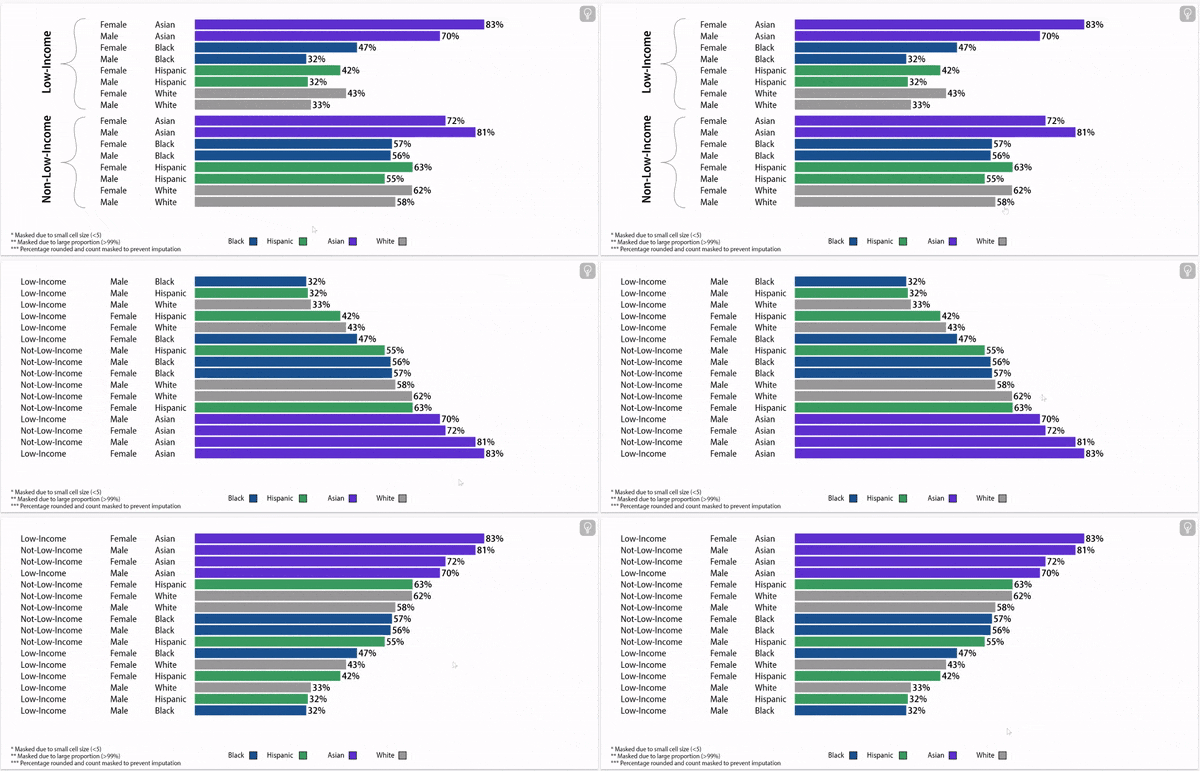
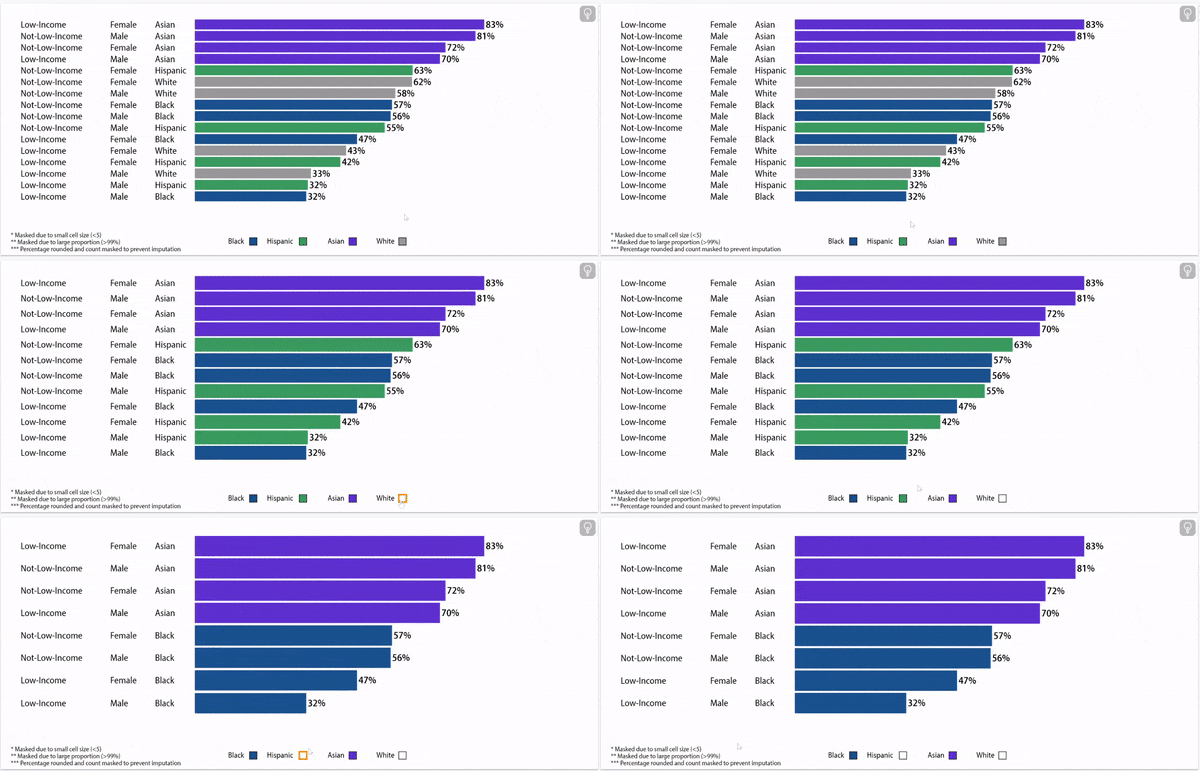
Reviewing the latest kindergarten literacy assessment data by student groups based on their gender, income, and race provides a closer look at which student groups are underserved and can benefit most from evidence-based supports for early learning. Gender, income, and race can compound the effect on a student’s experience of education systems, and how well the system prepares those students for success.

Meets K-Readiness Standard on Literacy Assessment, 2023

Please note: The first 16-way graph shows the outcomes for the TX-KEA assessment and the second 16-way graph shows the outcomes for the M-CLS.


Once again, the individual assessment data shows a similar story in terms of who is supported by education systems to achieve kindergarten readiness in literacy, but the difference in assessment sensitivity is apparent. What disparities do you see between student groups and/or assessment type?

Meets K-Readiness Standard on KEA, 2023

Meets K-Readiness Standard on M-CLS, 2023

About this data:

The following data present aggregate counts of students who met the kindergarten literacy assessment benchmark during the 2021-2022 school year. Educators administer these assessments at the beginning of the school year and serve as an indicator of how effectively our education and early learning systems are preparing students with the necessary skills to meet kindergarten literacy standards. Data below also illustrate the percentage of kindergarten students who were deemed "kindergarten-ready" based on the TX-KEA and M-CLS assessments, which were introduced in 2020-2021. However, it is important to note that data from prior years cannot be used to compare performance across regions due to the much larger number of approved assessments that were used and reported to the TEA.

Important Notes:

E3 Alliance relies primarily on data from the University of Texas Education Research Center (ERC) which is subject to a delay in availability due to state approval and analysis time. As a result, the graphs below present the most recent available year of data for the kindergarten literacy assessment.

The conclusions of this research do not necessarily reflect the opinions or official position of the Texas Education Agency, the Texas Higher Education Coordinating Board, or the State of Texas.