Grade 9 Retention Profile
Jump to: Source and cohort information about this data.
2021-22
12%
1,665 / 13,674
El Paso
Grade 9 Retention Rate
2021-22
8%
2,887 / 35,388
San Antonio
Grade 9 Retention Rate
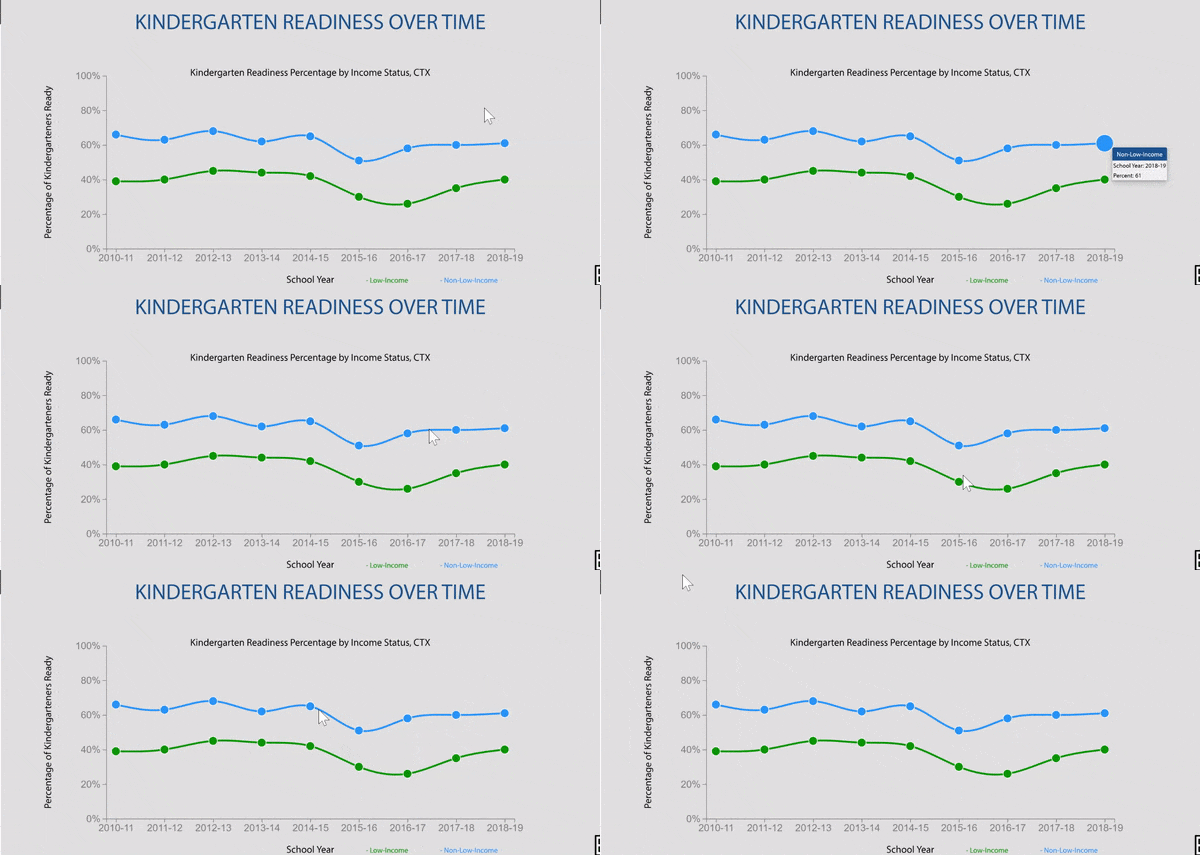
Texas grade 9 retention rates were decreasing until pandemic impact.
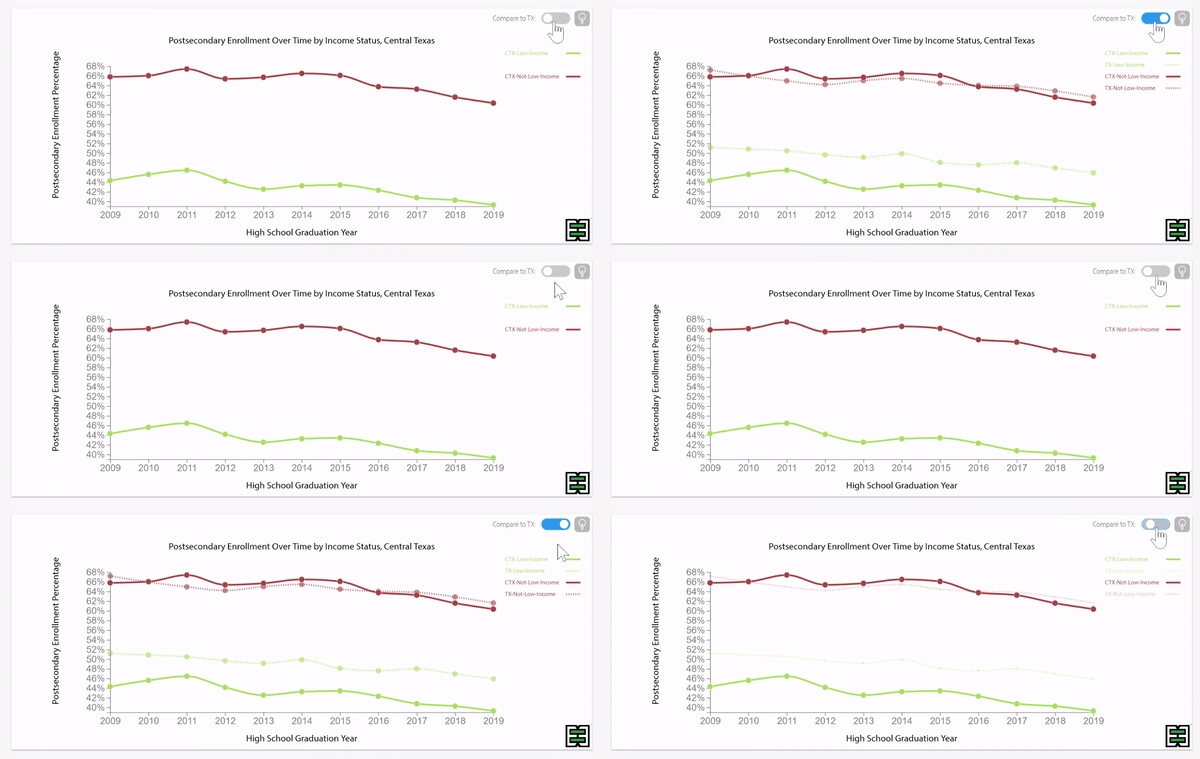
Disparities exist in grade 9 retention rates when comparing across household income status in Texas.
Texas grade 9 retention rates by household income status were stable until pandemic impact.
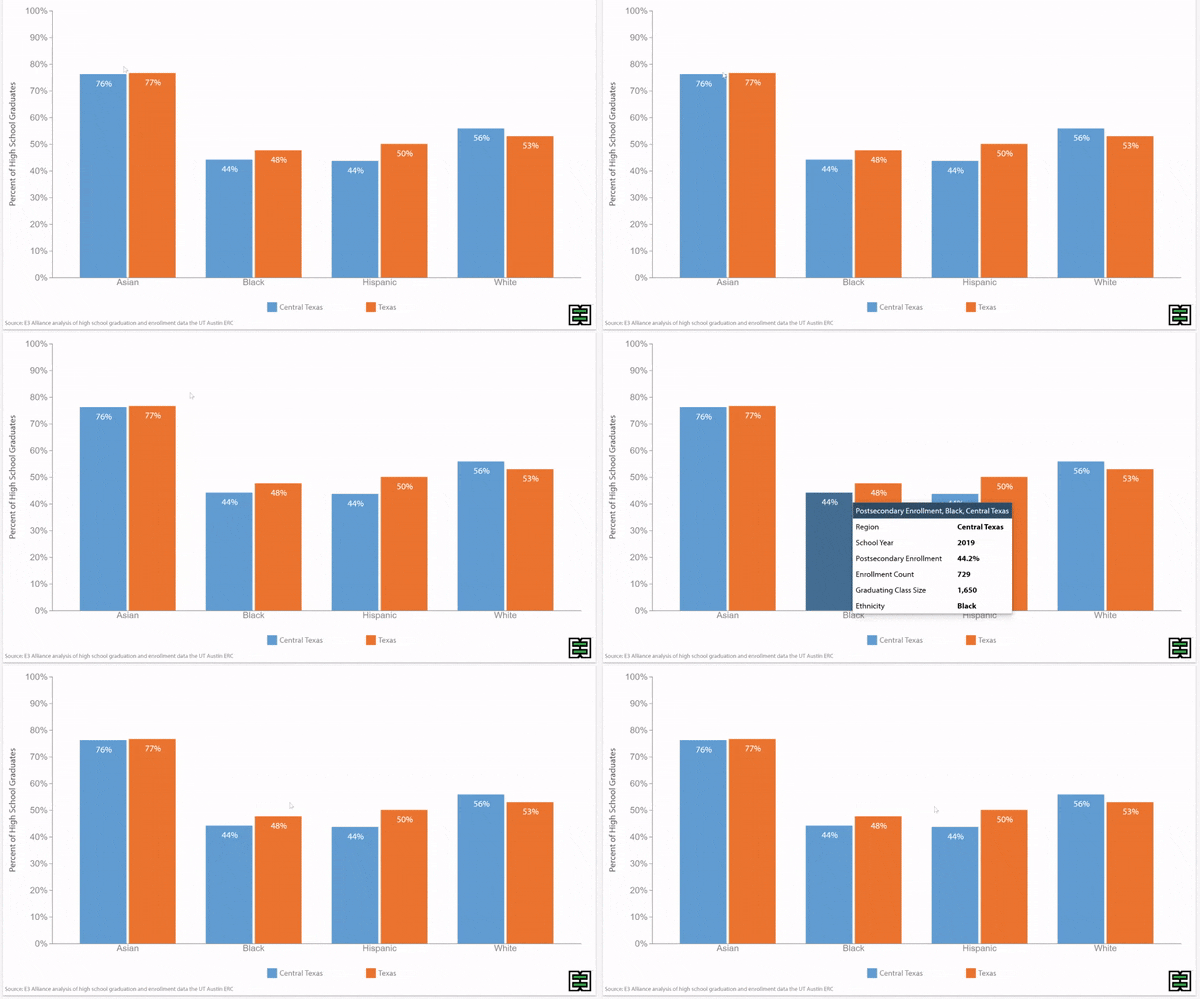
Grade 9 retention rates vary by race/ethnicity in Texas.
Disparities in grade 9 retention rates by race/ethnicity persist over time in Texas.
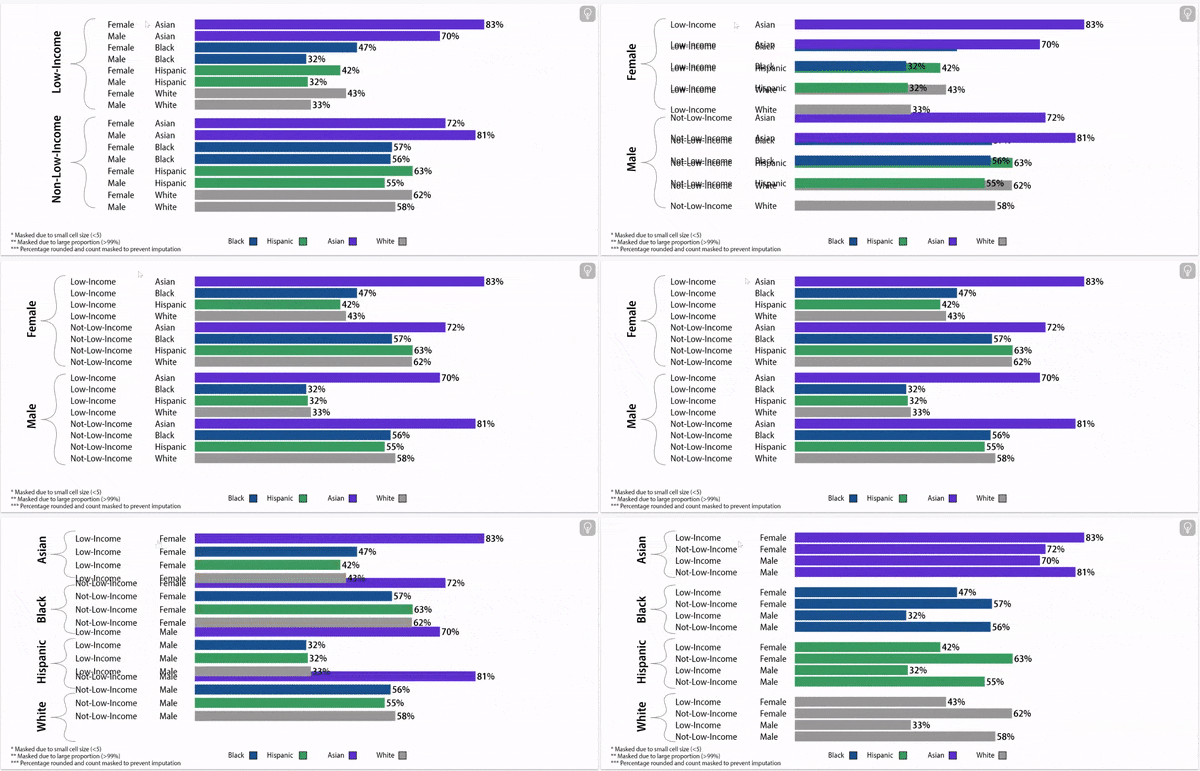
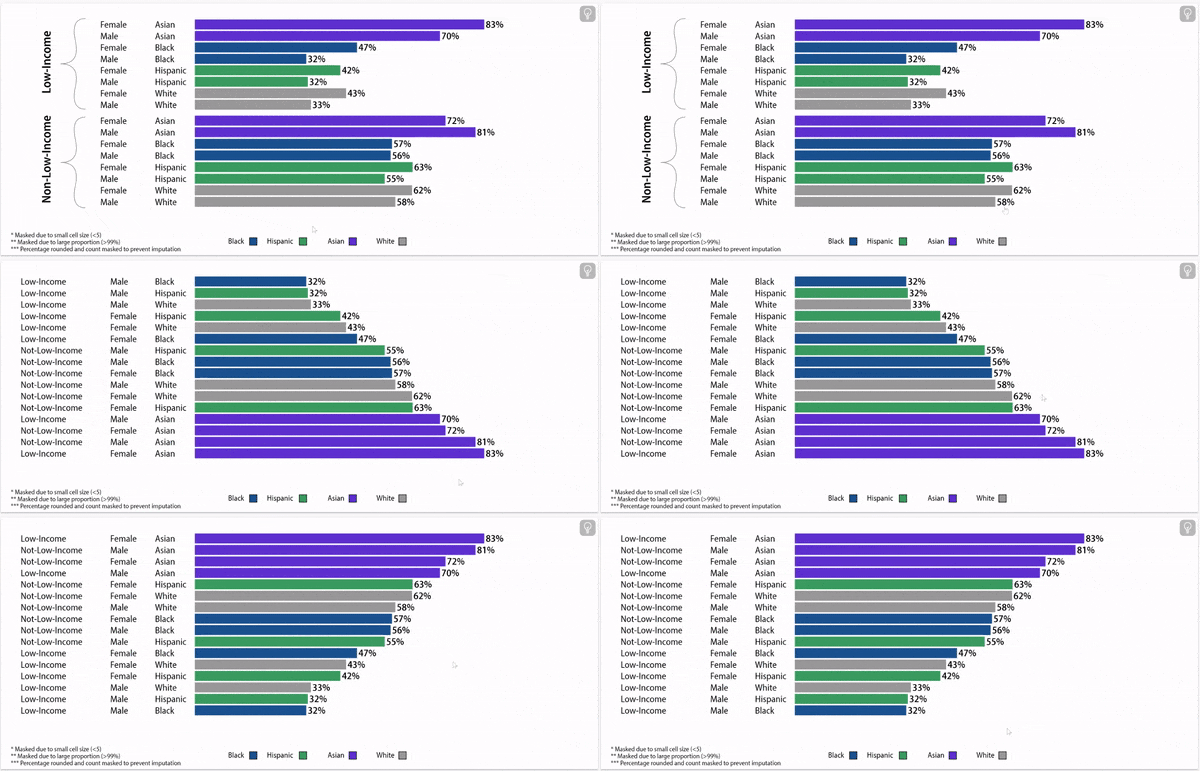
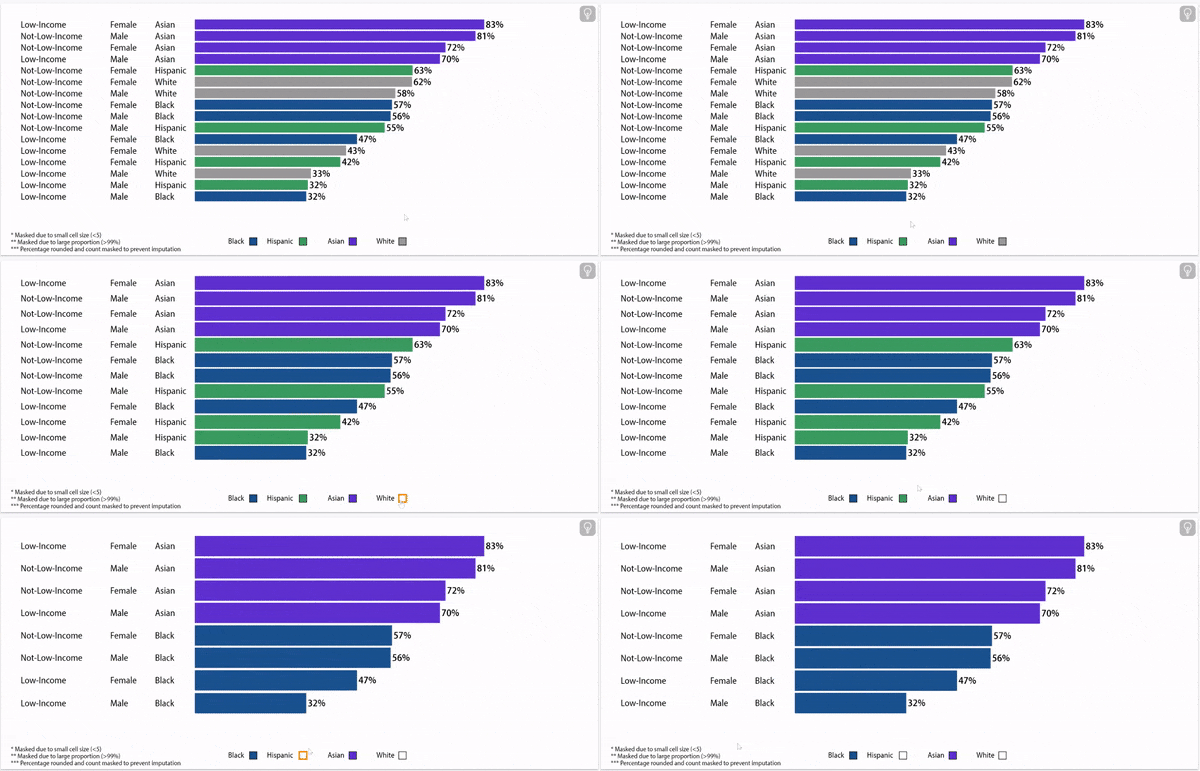
Digging deeper: grade 9 retention rates vary by household income status, gender, and race/ethnicity.
Grade 9 Retention Rate, 2022
About this data:
E3 Alliance relies primarily on data from the University of Texas Education Research Center (ERC). This data allows for a longitudinal understanding of grade 9 retention based on where and when a student attends high school. This data pertains to first-time grade 9 students who were enrolled within the state of Texas during their grade 9 year and the following school year.
Following are items to note:
The year of the data represents the year when students were in grade 9. A student is defined as having been retained in grade 9 if the student is still enrolled in grade 9 in the fall following their first-time grade 9 school year. There is a delay in data availability due to state approval within the ERC and analysis time. As such, if you choose to explore data from Central Texas, the graphs below present grade 9 retention data in the most recent available year in Texas schools.
Outcomes that reference data from 2021, 2022, or 2023 do not include San Marcos CISD, due to a data discrepancy.

