AP Course Completion
Jump to: Source and cohort information about this data.
AP Course Completion
The chart below shows the participation levels from the Senior Year cohort of 2021 for Texas and Central Texas in AP courses. While over 50% of students across Texas completed at least one AP course, Central Texas had an even greater proportion of its students completing AP courses.
Increase in AP Course Completion Rate Slowing
While the percentage of the 2021 Senior Cohort who completed one or more AP course represents a significant increase as compared to the 2013 cohort, the proportion has remained relatively stagnant in the last two years. As compared to the 2021 Cohort statewide, a greater portion of the 2021 Cohort in Central Texas completed at least one AP course.
Disparities Exist in AP Course Completion by Household Income
Students from low-income households in Texas and in Central Texas see a significantly lower number of AP courses completed when compared to students from not-low-income households. In Central Texas, 50% of students from low-income households completed at least one AP course, as compared to 72% for students from not-low-income households; 9% of students from low-income households completed more than six AP courses, as compared to 25% for students from not-low-income households.
Increase in AP Course Completion Rate Slowing, Regardless of Income Status
While the percentage of the 2021 Senior Cohort -- for both students from low-income families and from not-low-income families -- who completed one or more AP course represents a significant increase as compared to the 2013 cohort, the proportion has remained relatively stagnant in the last two years. The AP course completion gap between students from low-income families and those from not-low-income families has remained constant since 2013.
Disparities Exist in AP Course Completion by Race
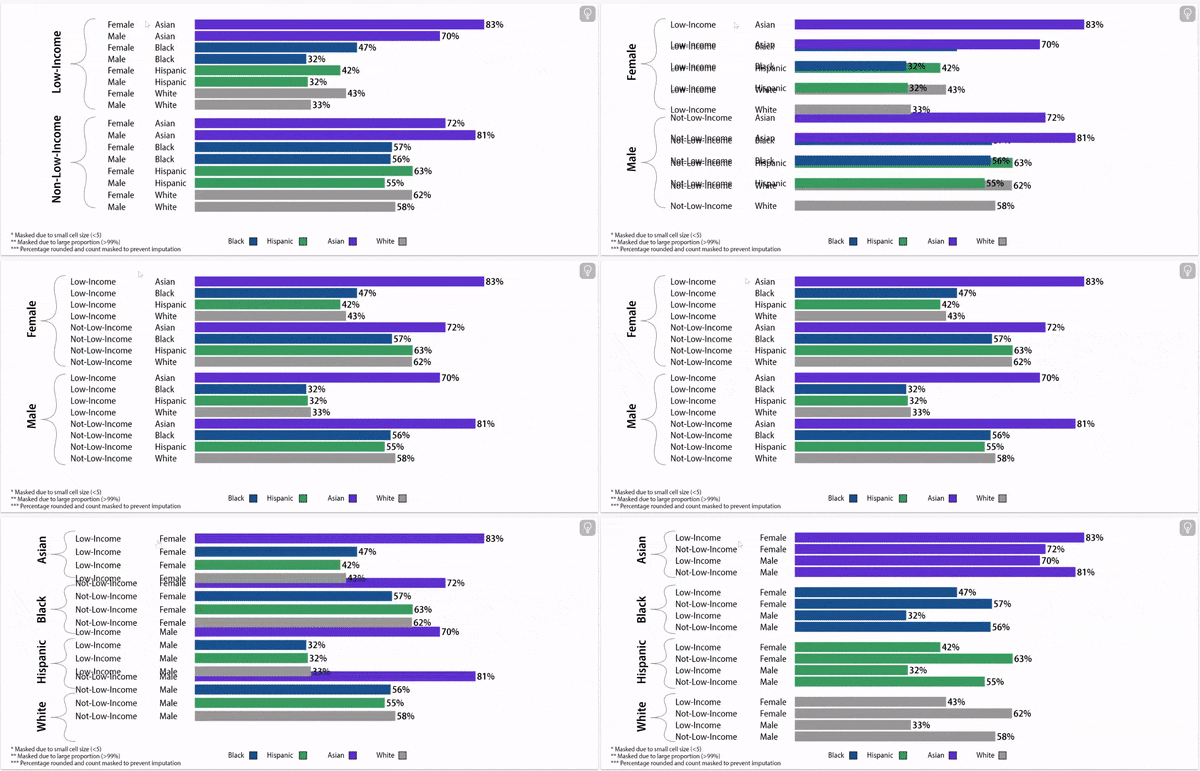
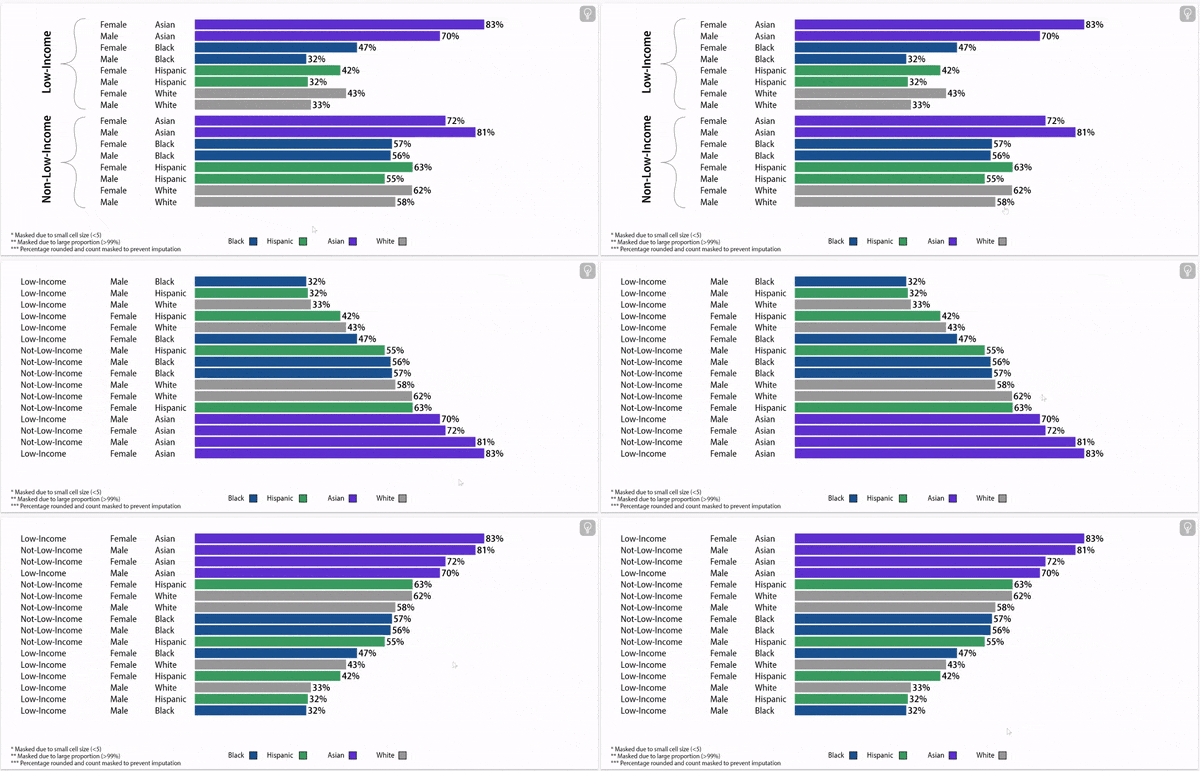
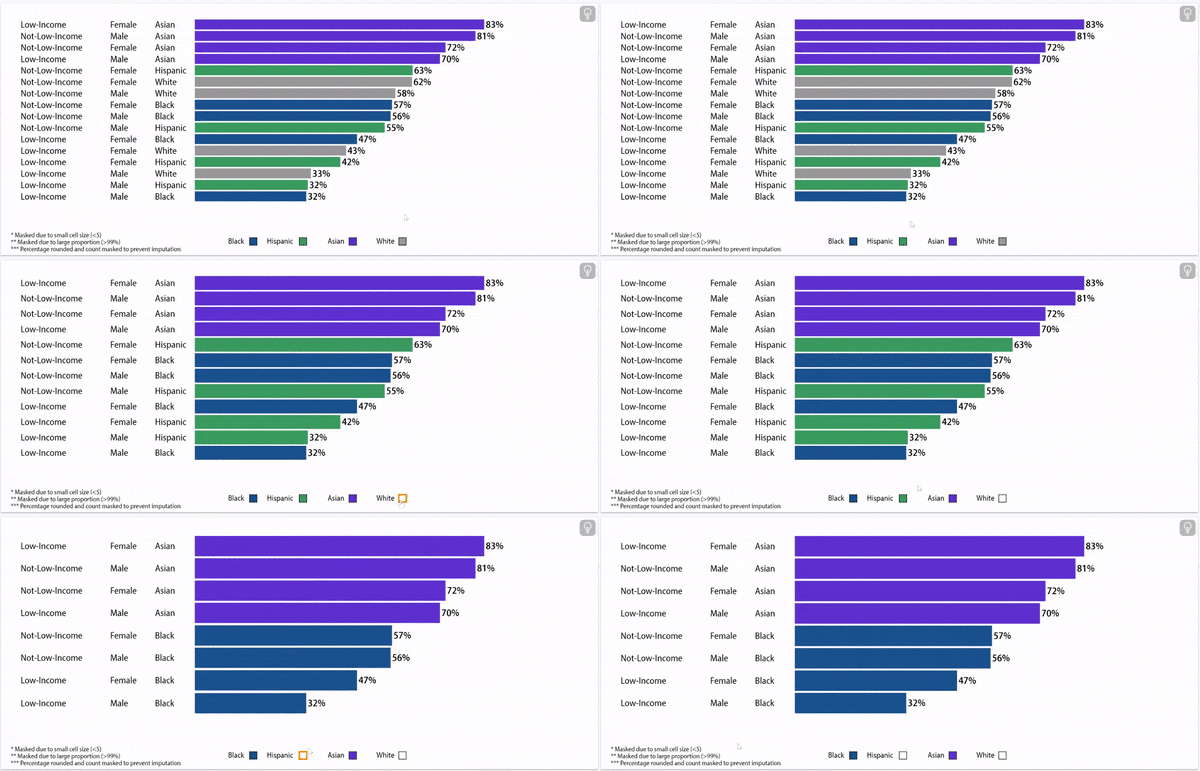
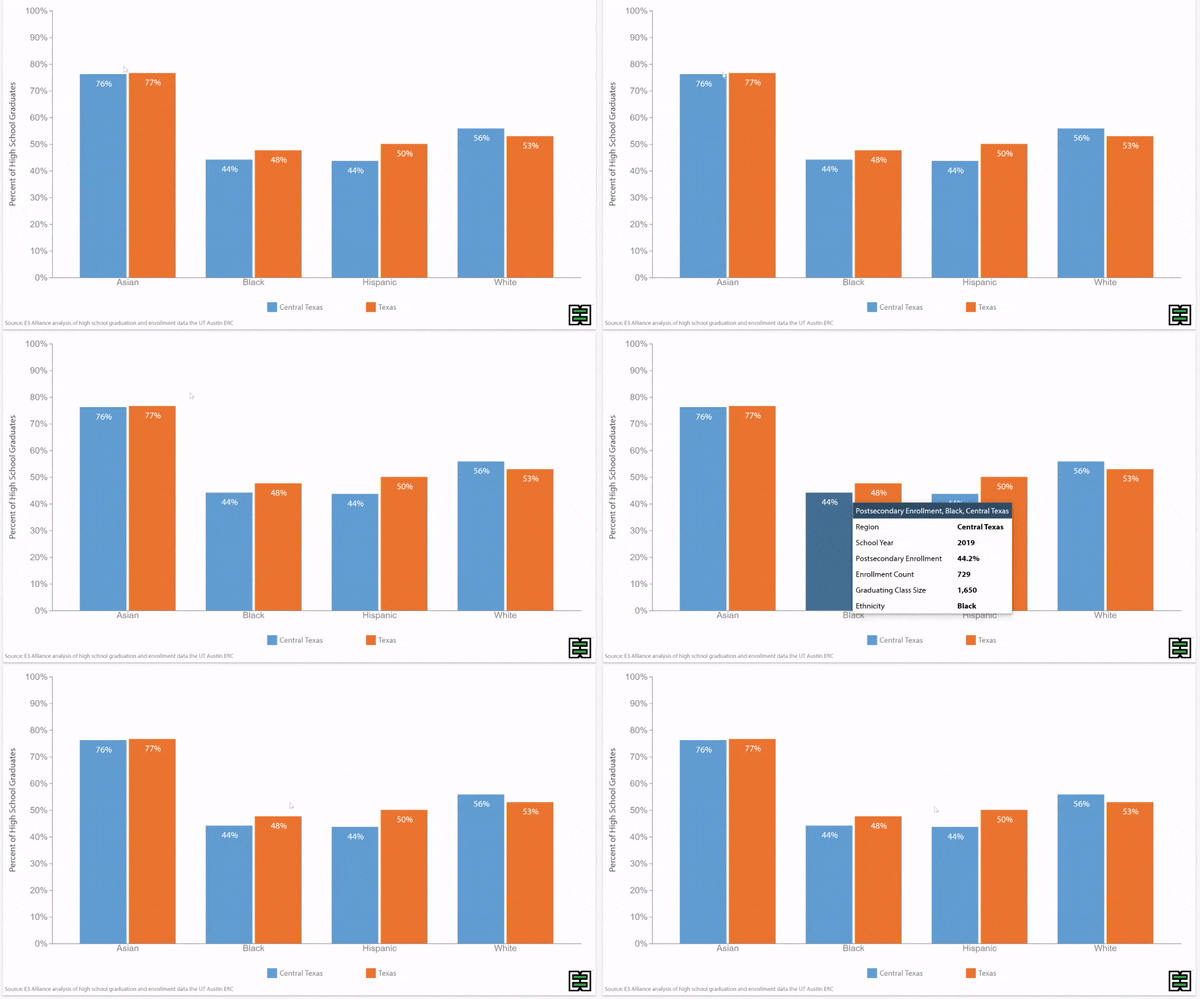
Traditionally underrepresented students see less AP course completion both in Central Texas and across the state. Black and Hispanic students complete fewer AP courses in each band of analysis (1-2, 3-4, 5-6 and 6+) as compared to White and Asian students.
Increase in AP Course Completion Rate Slowing, Regardless of Race
While the percentage of students who completed one or more AP courses has increased since 2013, the proportion has remained relatively stagnant in the last five years. The AP course completion gaps between racial groups still persist.
Disparities Exist in AP Course Completion by Emergent Bilingual Status
High School Graduates Completing Any AP Course, Class of 2023
AP Course Completion Varies by Subject
About this data:
E3 Alliance relies primarily on data from the University of Texas Education Research Center (ERC). This data allows for a longitudinal understanding of AP course completion, based on where and when a student graduates from high school. This data pertains to graduates from within the state of Texas who completed AP course(s) while in high school.
Following are items to note:
The data represents the year the students graduated from high school. There is a delay in data availability due to state approval within the ERC and analysis time. Therefore, the graphs below present CTE Participation and completion from the 2021 graduating class of students.
Cohort: First-time 9th grade students who graduate within four years, including students who transfer in
Outcomes that reference data from 2021, 2022, or 2023 do not include San Marcos CISD, due to a data discrepancy.

