STAAR Grade 3 Math Meets Standard
Studying results from key years such as third and eighth grade STAAR exams allows us to understand how to better serve students during these transition years.
Jump to: Source and cohort information about this data.
2022
41%
154,950 / 375,191
Texas
STAAR Grade 3 Meets Math Rate
2022
43%
11,230 / 26,099
Central Texas
STAAR Grade 3 Meets Math Rate
Disparities Exist in STAAR Grade 3 Math by Household Income
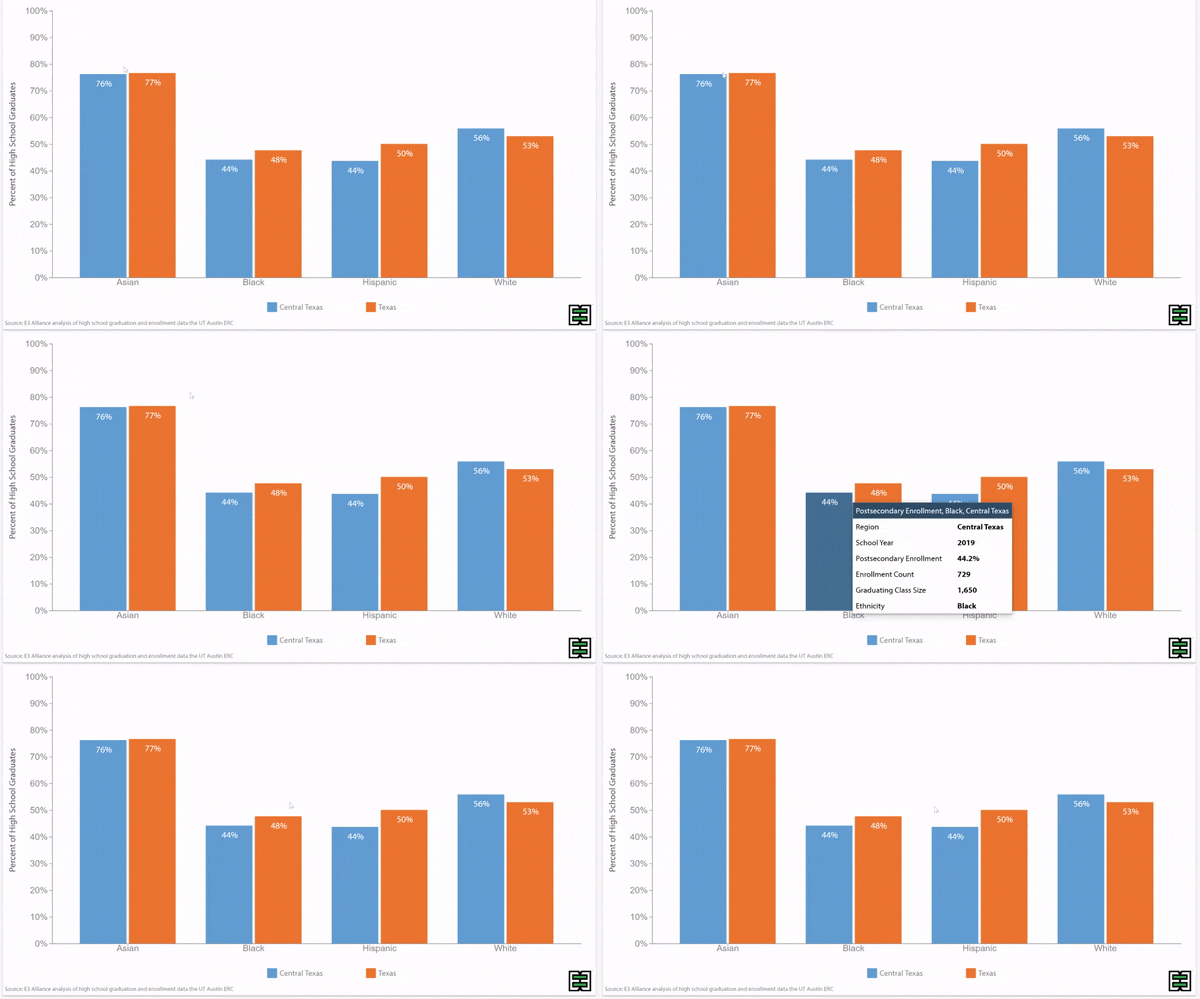
STAAR Grade 3 Math Outcomes Vary by Race
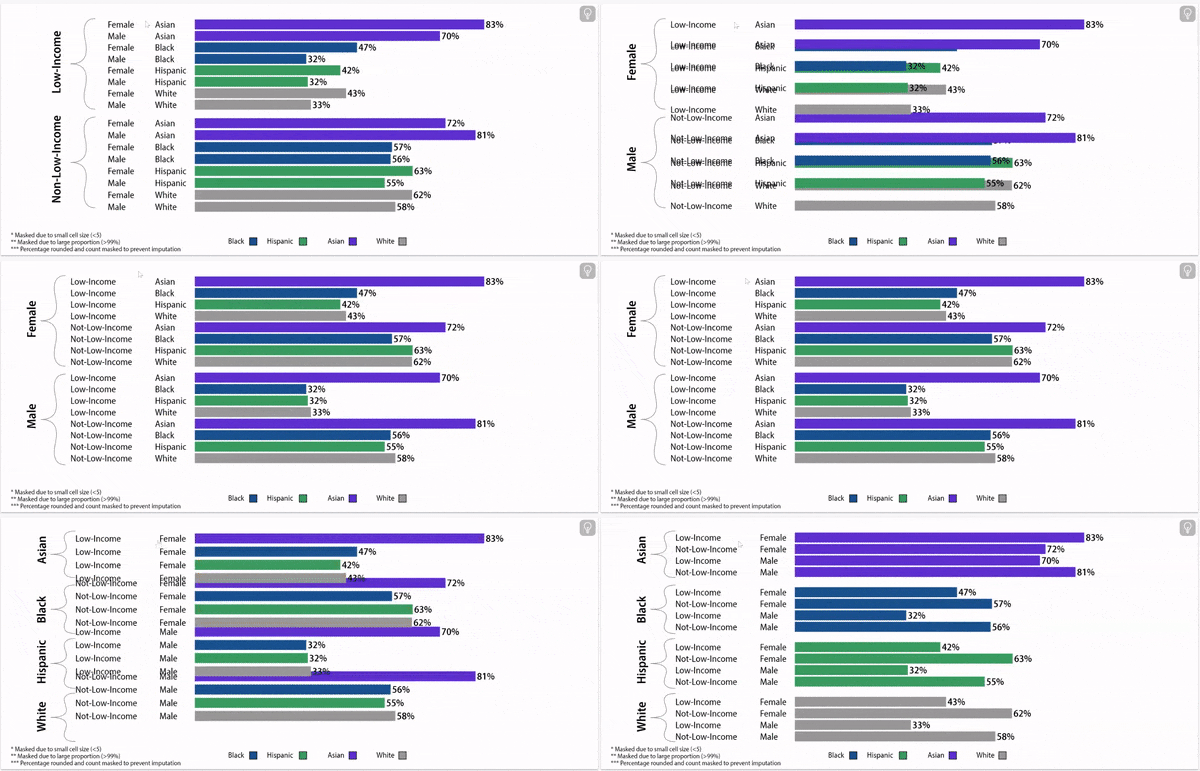
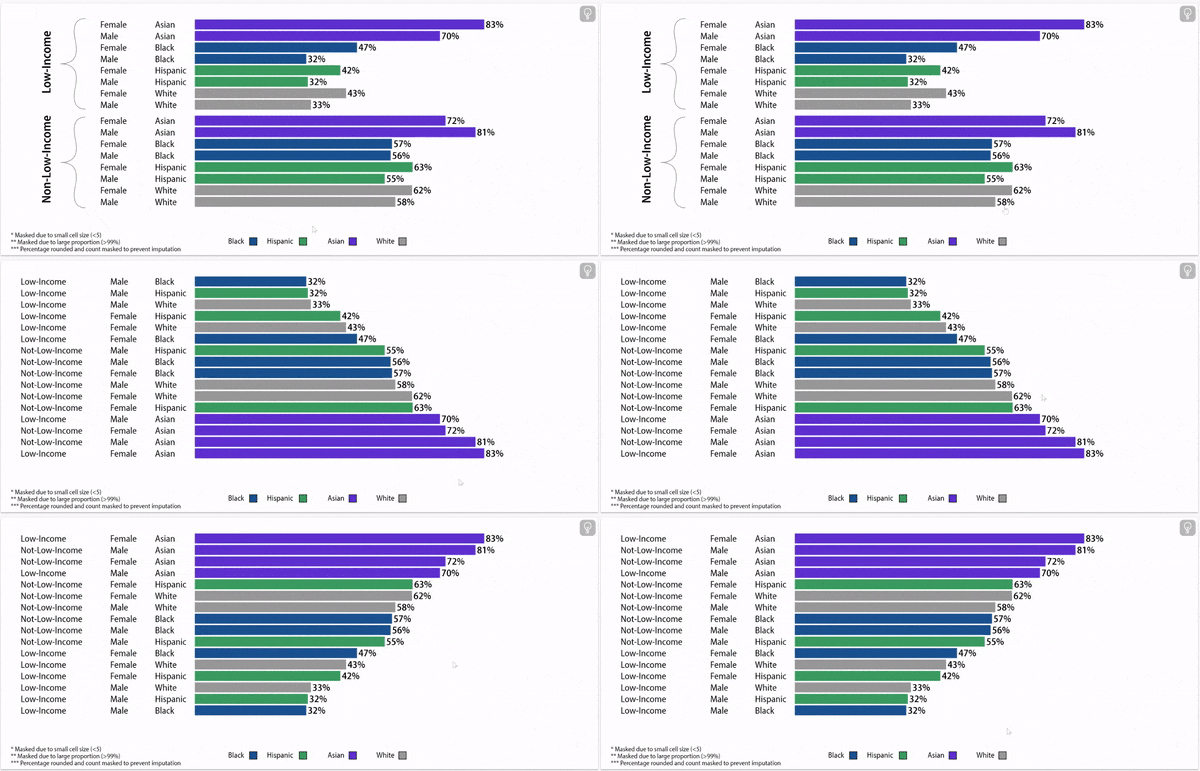
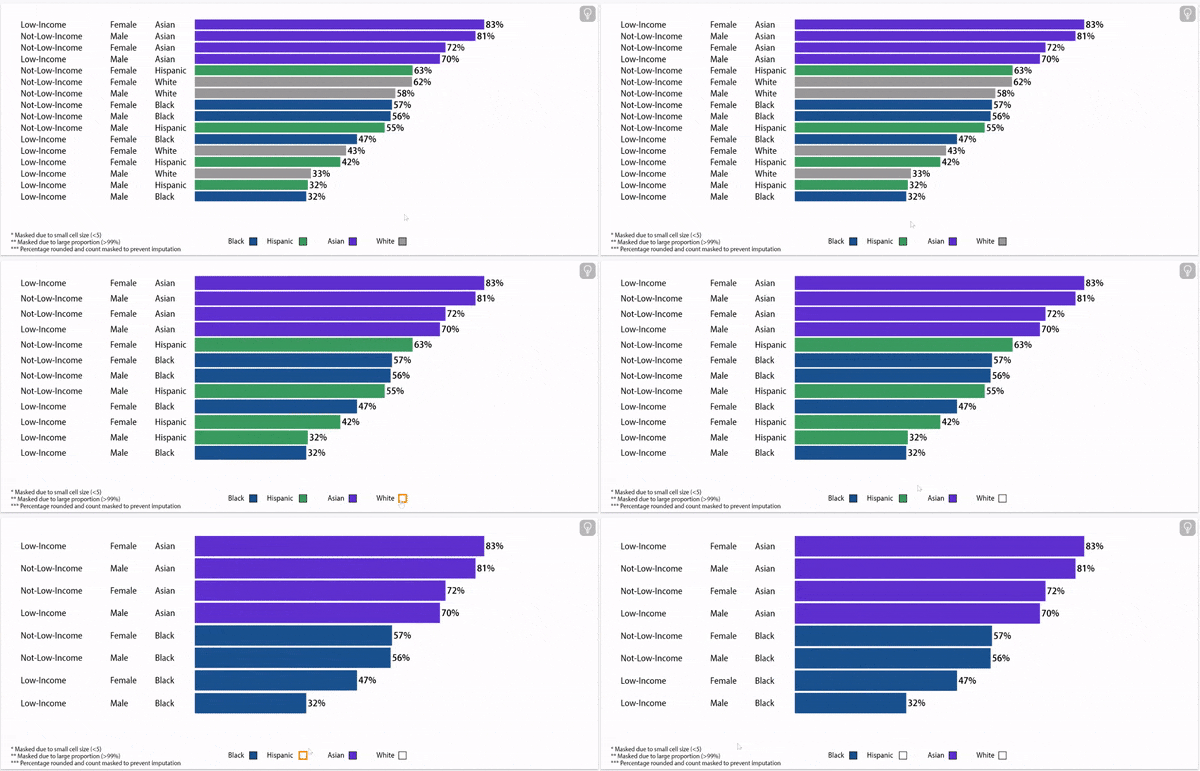
Digging Deeper: Gender, Income, and Race Play a Role in STAAR Grade 3 Math
STAAR Grade 3 Math: Meets Rate, 2022
About this data:
E3 Alliance relies primarily on data from the University of Texas Education Research Center (ERC). This data allows for a year-by-year understanding of STAAR 3rd Grade Math achievement based on where and when a student takes the exam. This data pertains to 3rd grade students who were enrolled within the state of Texas and took the exam during the spring of the given school year.
Following are items to note:
The year of the data represents the year students took STAAR 3rd Grade Math. STAAR 3rd Grade Math rates reflect whether a student met 3rd grade standards on the exam.
TEA loosened its requirements for the 3rd grade STAAR in 2020-2021 for remote students, 2020-2021 STAAR data should be interpreted with caution and may not be comparable to prior years because of this change in response to the Covid-19 pandemic.
There is a delay in data availability due to state approval within the ERC and analysis time. As such, if you choose to explore data from Central Texas, the graphs below present STAAR 3rd Grade Math data in the most recent available year in Texas schools.


