High School Graduation Profile
Even with these changes, students have unequal access to supports and resources that impact their likelihood of high school graduation, leading to disparities in graduation rates by gender, household income, and race. Factors like chronic absence and high mobility impact graduation rates, even when students experience them in middle and early high school.
Jump to: Source and cohort information about this data.
2022-23
89%
29,931 / 33,593
San Antonio
Four-Year High School Graduation Rate
2022-23
92%
23,302 / 25,204
Rio Grande Valley
Four-Year High School Graduation Rate
Despite fluctuations, Texas graduation rates have remained largely unchanged.
Disparities exist in Texas high school graduation rates by household income status.
Despite fluctuations, Texas graduation rates by household income status have remained largely unchanged.
High school graduation rates vary by race/ethnicity in Texas.
High school graduation rates by race/ethnicity have remained largely unchanged over the last decade.
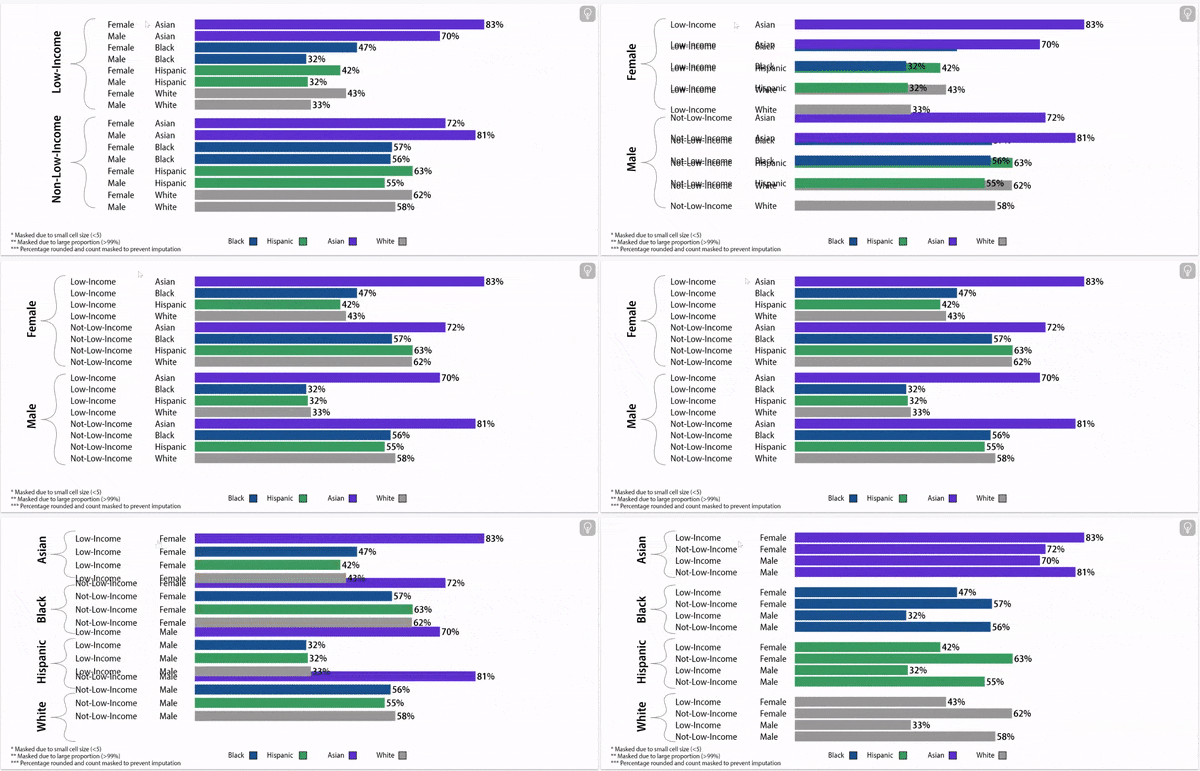
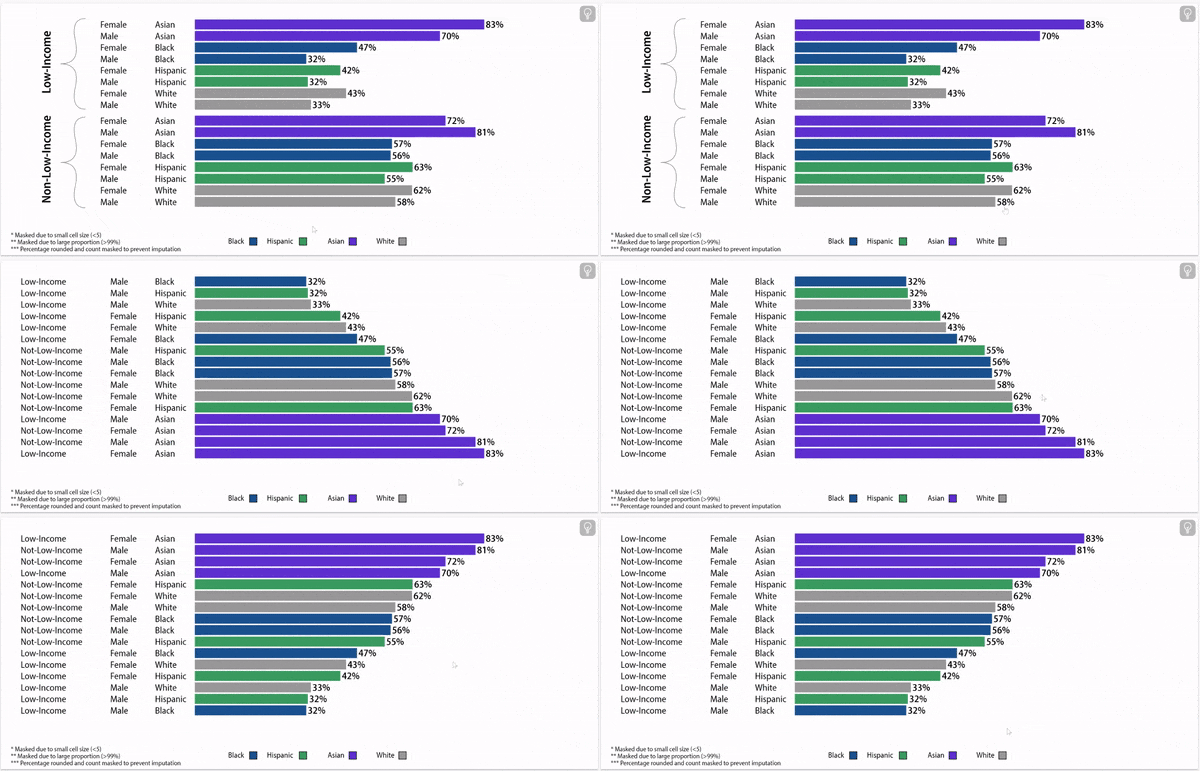
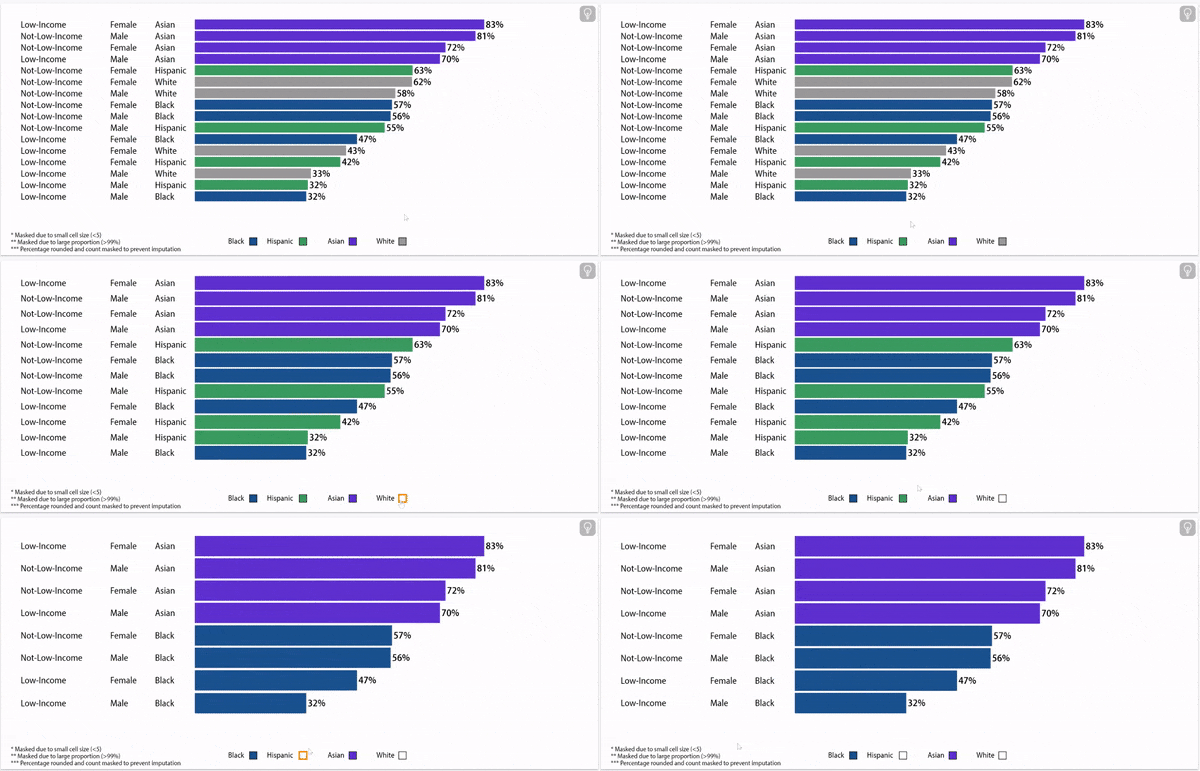
High school graduation rates vary by household income status, gender, and race/ethnicity.
Four-Year High School Graduation Rates, Class of 2023
About this data:
E3 Alliance relies primarily on data from the University of Texas Education Research Center (ERC). This data allows for a year-by-year understanding of high school graduation based on where a student attends school. This data pertains to high school students who were enrolled within the state of Texas for any grades 9-12, excluding students who left the Texas public education system for reasons other than dropping out.
Following are items to note:
The year of the data represents the year of high school graduation. Intra-year moves reflect whether a student moved to a different school during a given school year. There is a delay in data availability due to state approval within the ERC and analysis time. As such, if you choose to explore data from Central Texas, the graphs below present high school graduation data in the most recent available year in Texas schools.
Cohort: First-time 9th grade students who graduate within four years, including students who transfer in
Outcomes that reference data from 2021, 2022, or 2023 do not include San Marcos CISD, due to a data discrepancy.

