Math Pathways | Middle School Math Profile
For more information about this data, please click here.
34%
37,873 / 112,110
Dallas/Fort Worth
Middle School Algebra 1 Completion Rate
30%
127,209 / 424,544
Texas
Middle School Algebra 1 Completion Rate
The Amount of Math Students Take Matters
E3 Alliance research found that students who take four years of math in high school, regardless of the level, are twice as likely to complete a postsecondary credential, associate’s degree, or bachelor’s degree in six years compared to students who took less than four years of math.
Who is taking more advanced math courses?
The pathway to complete college-aligned coursework in high school starts early for most students, usually in elementary or middle school. Therefore, E3 focused on math course taking patterns for students in middle school as a leading indicator that students will be prepared to take four years of math in high school, with the fourth year aligned with college standards.
In 2017, E3 Alliance studied the most recent cohort of eighth graders and looked back at their fifth grade STAAR test scores. The research found that students who scored in the top forty percent of all STAAR test takers experienced high rates of success on advanced middle school math pathways. At the same time fewer than 33% of Black students, 46% of Hispanic students with STAAR scores in the top 20% of all Texas STAAR takers in fifth grade, who attended eighth grade in Central Texas, had completed Algebra I by eighth grade. Unfortunately, research by E3 Alliance showed that decisions to move students onto those pathways did not seem to be based on any objective measure of their capacity to succeed, but instead reinforced biased perceptions of students’ math aptitude.
Increasing Access and Opportunity to Math Pathways
Education systems that ensure equitable access to and support for advanced math course-taking create conditions where students are likely to succeed. Students who have shown the aptitude to succeed in math in elementary school must be given opportunities to pursue advanced math in middle and high school, regardless of their race, household income, or gender.
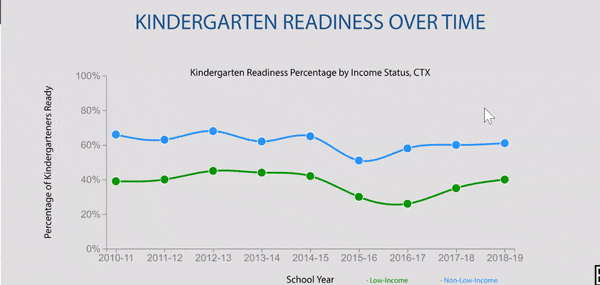
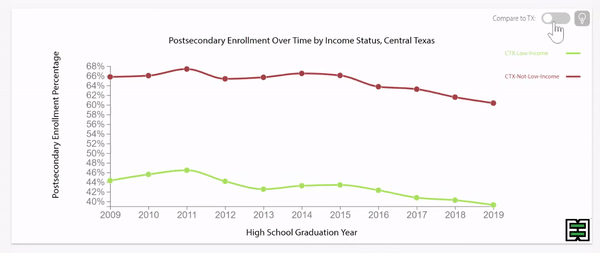
Middle School Algebra I Completion has Increased in Last Decade
Texas has seen an overall upward trend in middle school Algebra I completion rates for the past ten years. This suggests that education systems in Texas are making advanced coursework available to more students, but do all students have access to complete advanced coursework?
Use the comparison feature to see how the trend in your region compares to the state.
Disparities in Middle School Algebra I Completion by Household Income Have Not Decreased in Texas
The education system in Texas does not have adequate structures in place to ensure equal access and support for advanced middle school math pathways for students from low-income households. This systemic issue has resulted in continued disparities in middle school Algebra I completion rates between students from low-income and non-low-income households, despite an overall increase in completion rates for both groups over the past ten years.
Use the comparison feature to view the trend in your region as compared to the state. Is the trend moving in the same direction? Are the disparities increasing, decreasing, or remaining the same over time?
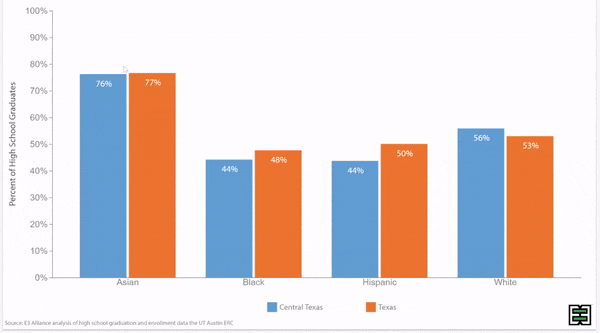
Disparities in Middle School Algebra I Completion by Race Persist Over Time
Texas education systems do not provide equitable access to advanced math pathways in middle school to all racial groups. Despite an increase in middle school Algebra I completion rates for all student groups, the gap in access and support between the highest and lowest completing groups remains.
Use the comparison feature to look at trends in your region by race over the past ten years, as compared to the state. Are disparities increasing or decreasing in your region? Do some groups trend in different directions than others?
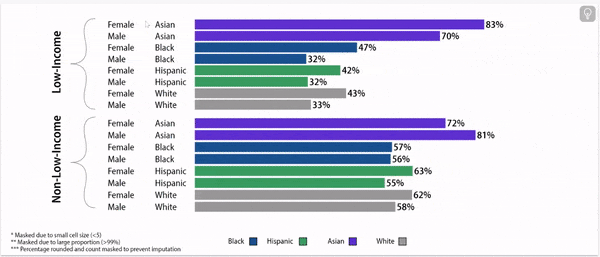
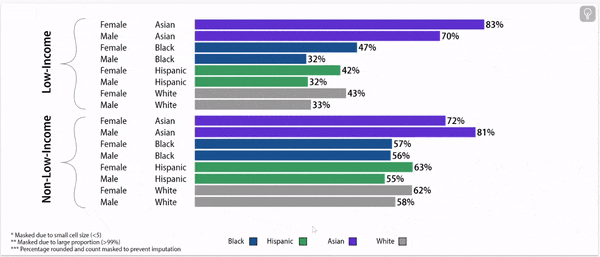
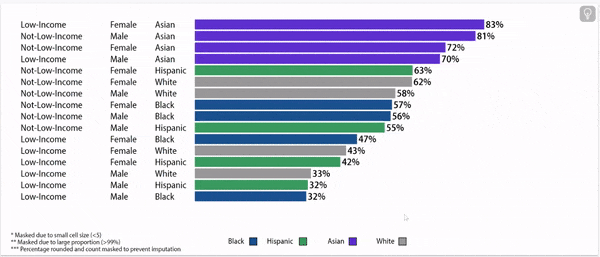
Digging Deeper: Gender, Income, and Race Play a Role in Middle School Algebra I Completion Rates
When educational systems do not provide equal access and support to academic opportunities based on factors such as gender, household income, and race, it can lead to compounded inequities for students who have already faced historical marginalization within the system. A large and persistent equity gap across metrics in an education system suggests that substantial systemic flaws are built into its design. Examining the data by gender, race, and household income reveals concerning differences in experience based solely on these factors.
Middle School Algebra 1 Completion Rates, 8th Grade Cohort, 2022
Identifying Promising Practices In Math Pathways
Through partnership with school districts in our region, we have been able to close the equity gap between White and Black high performing Central Texas students by over 85% since 2017. For more information on scaling this success statewide, click here. The chart below shows what percentage of students who scored in the top two quintiles on their fifth-grade math STAAR completed Algebra I by eighth grade, by cohort, over time. How equitable is your region in ensuring all high-performing students have access to advanced courses?
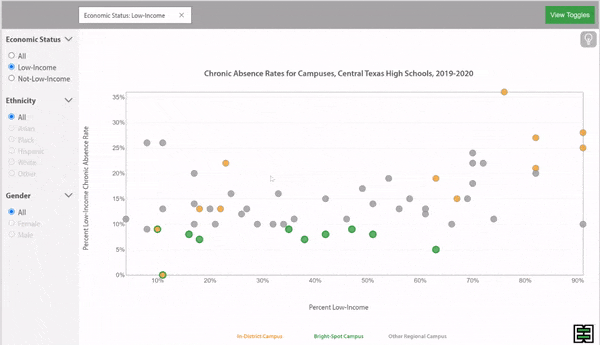
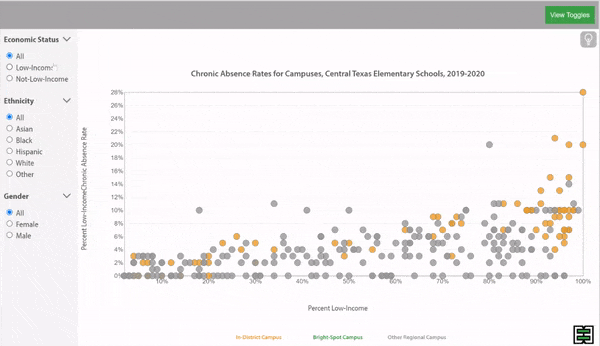
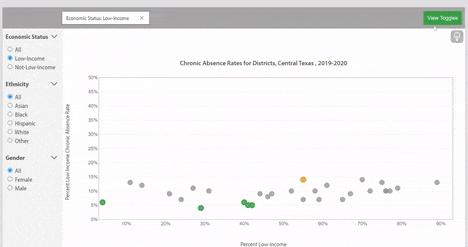
School District and Campus Level Metrics Can Illuminate Bright Spots
While substantial systemic inequities exist, some districts and campuses in the state may exceed expectations and implement policies and practices that promote students' access to and support for completing advanced math pathways in middle school.
The scatterplots below show districts and campuses in your region, comparing their demographic composition to their Algebra I completion rates. The default view compares the percent of low-income students in the eighth-grade cohort to the percent of low-income students who completed Algebra I by eighth grade. Use the radio button features to customize your view for specific student groups or use the toggle features to customize the scatterplot view.
Economic Status
Ethnicity
Gender
Economic Status
Ethnicity
Gender
About this data:
E3 Alliance relies primarily on data from the University of Texas Education Research Center (ERC). This data allows for a longitudinal understanding of middle school Algebra I in relation to their fifth grade STAAR performance. This data pertains to 8th grade students who were enrolled within the state of Texas at the end of a given school year. Data on high performing students is based on fifth grade STAAR results, regardless of where in Texas the student completed fifth grade. Students who did not attend fifth grade in Texas are not included in that portion of the analysis.
Following are items to note:
The year of the data represents the year that a given cohort finishes 8th grade. Students who took Algebra I prior to that year, who are in that 8th grade cohort are reported in the year they complete 8th grade. The data presented are the most recent data available in the Texas Education Research Center.